Varves of the Month for 7/1/2012 - 1/30/2013
Connecticut Valley Varves at Rt. 12A drill site in North Charlestown, N.H.
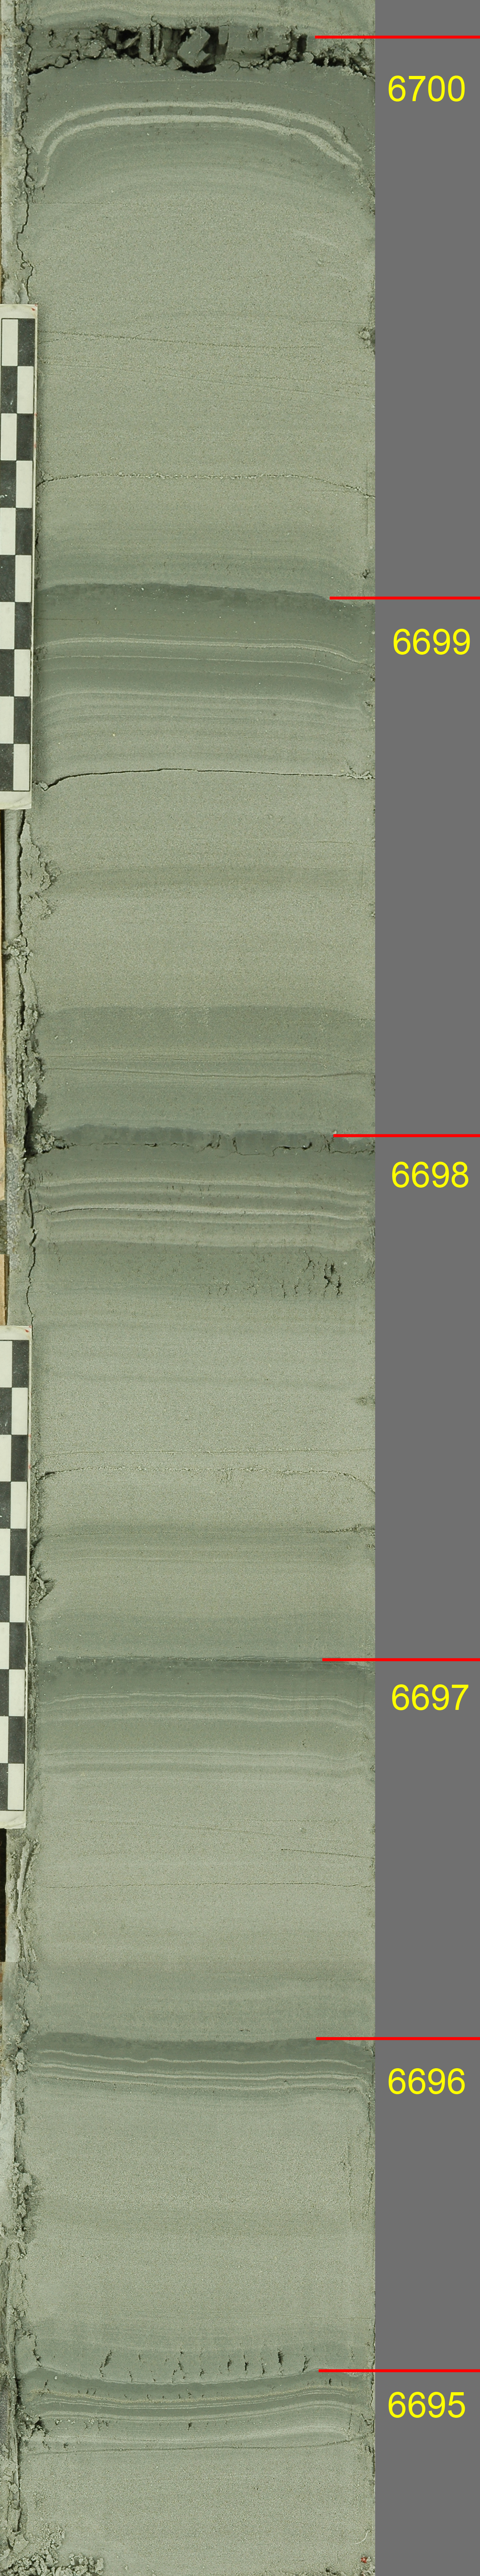
Scale bar in cm.
Click on image to download original image file
This month's image is three high resolution images stitched together from the bottom of a core collected along Rt. 12A in North Charlestown, N.H. Each varve is labeled with its annual number in the new North American Varve Chronology (NAVC). The varves shown here are distal to the ice front but are thick and sandy as a result of local delta progradation. The varves transition upward into very thick sandy varves and then lacustrine sand as the lake in this area filled with sediment. Sandy sediment was mostly coming from the Sugar and Little Sugar River valleys. The surficial geology of the drill site area is shown on the map below. The drill site sits on a stream terrace cut into sandy lake bottom sediment. A large dune field flanks the western side of Calavant Mountain from when the lake drained and exposed sand blew across the Connecticut Valley. Beneath the drill hole is at least another 50 m of varved silt and clay (Qlb on the map).
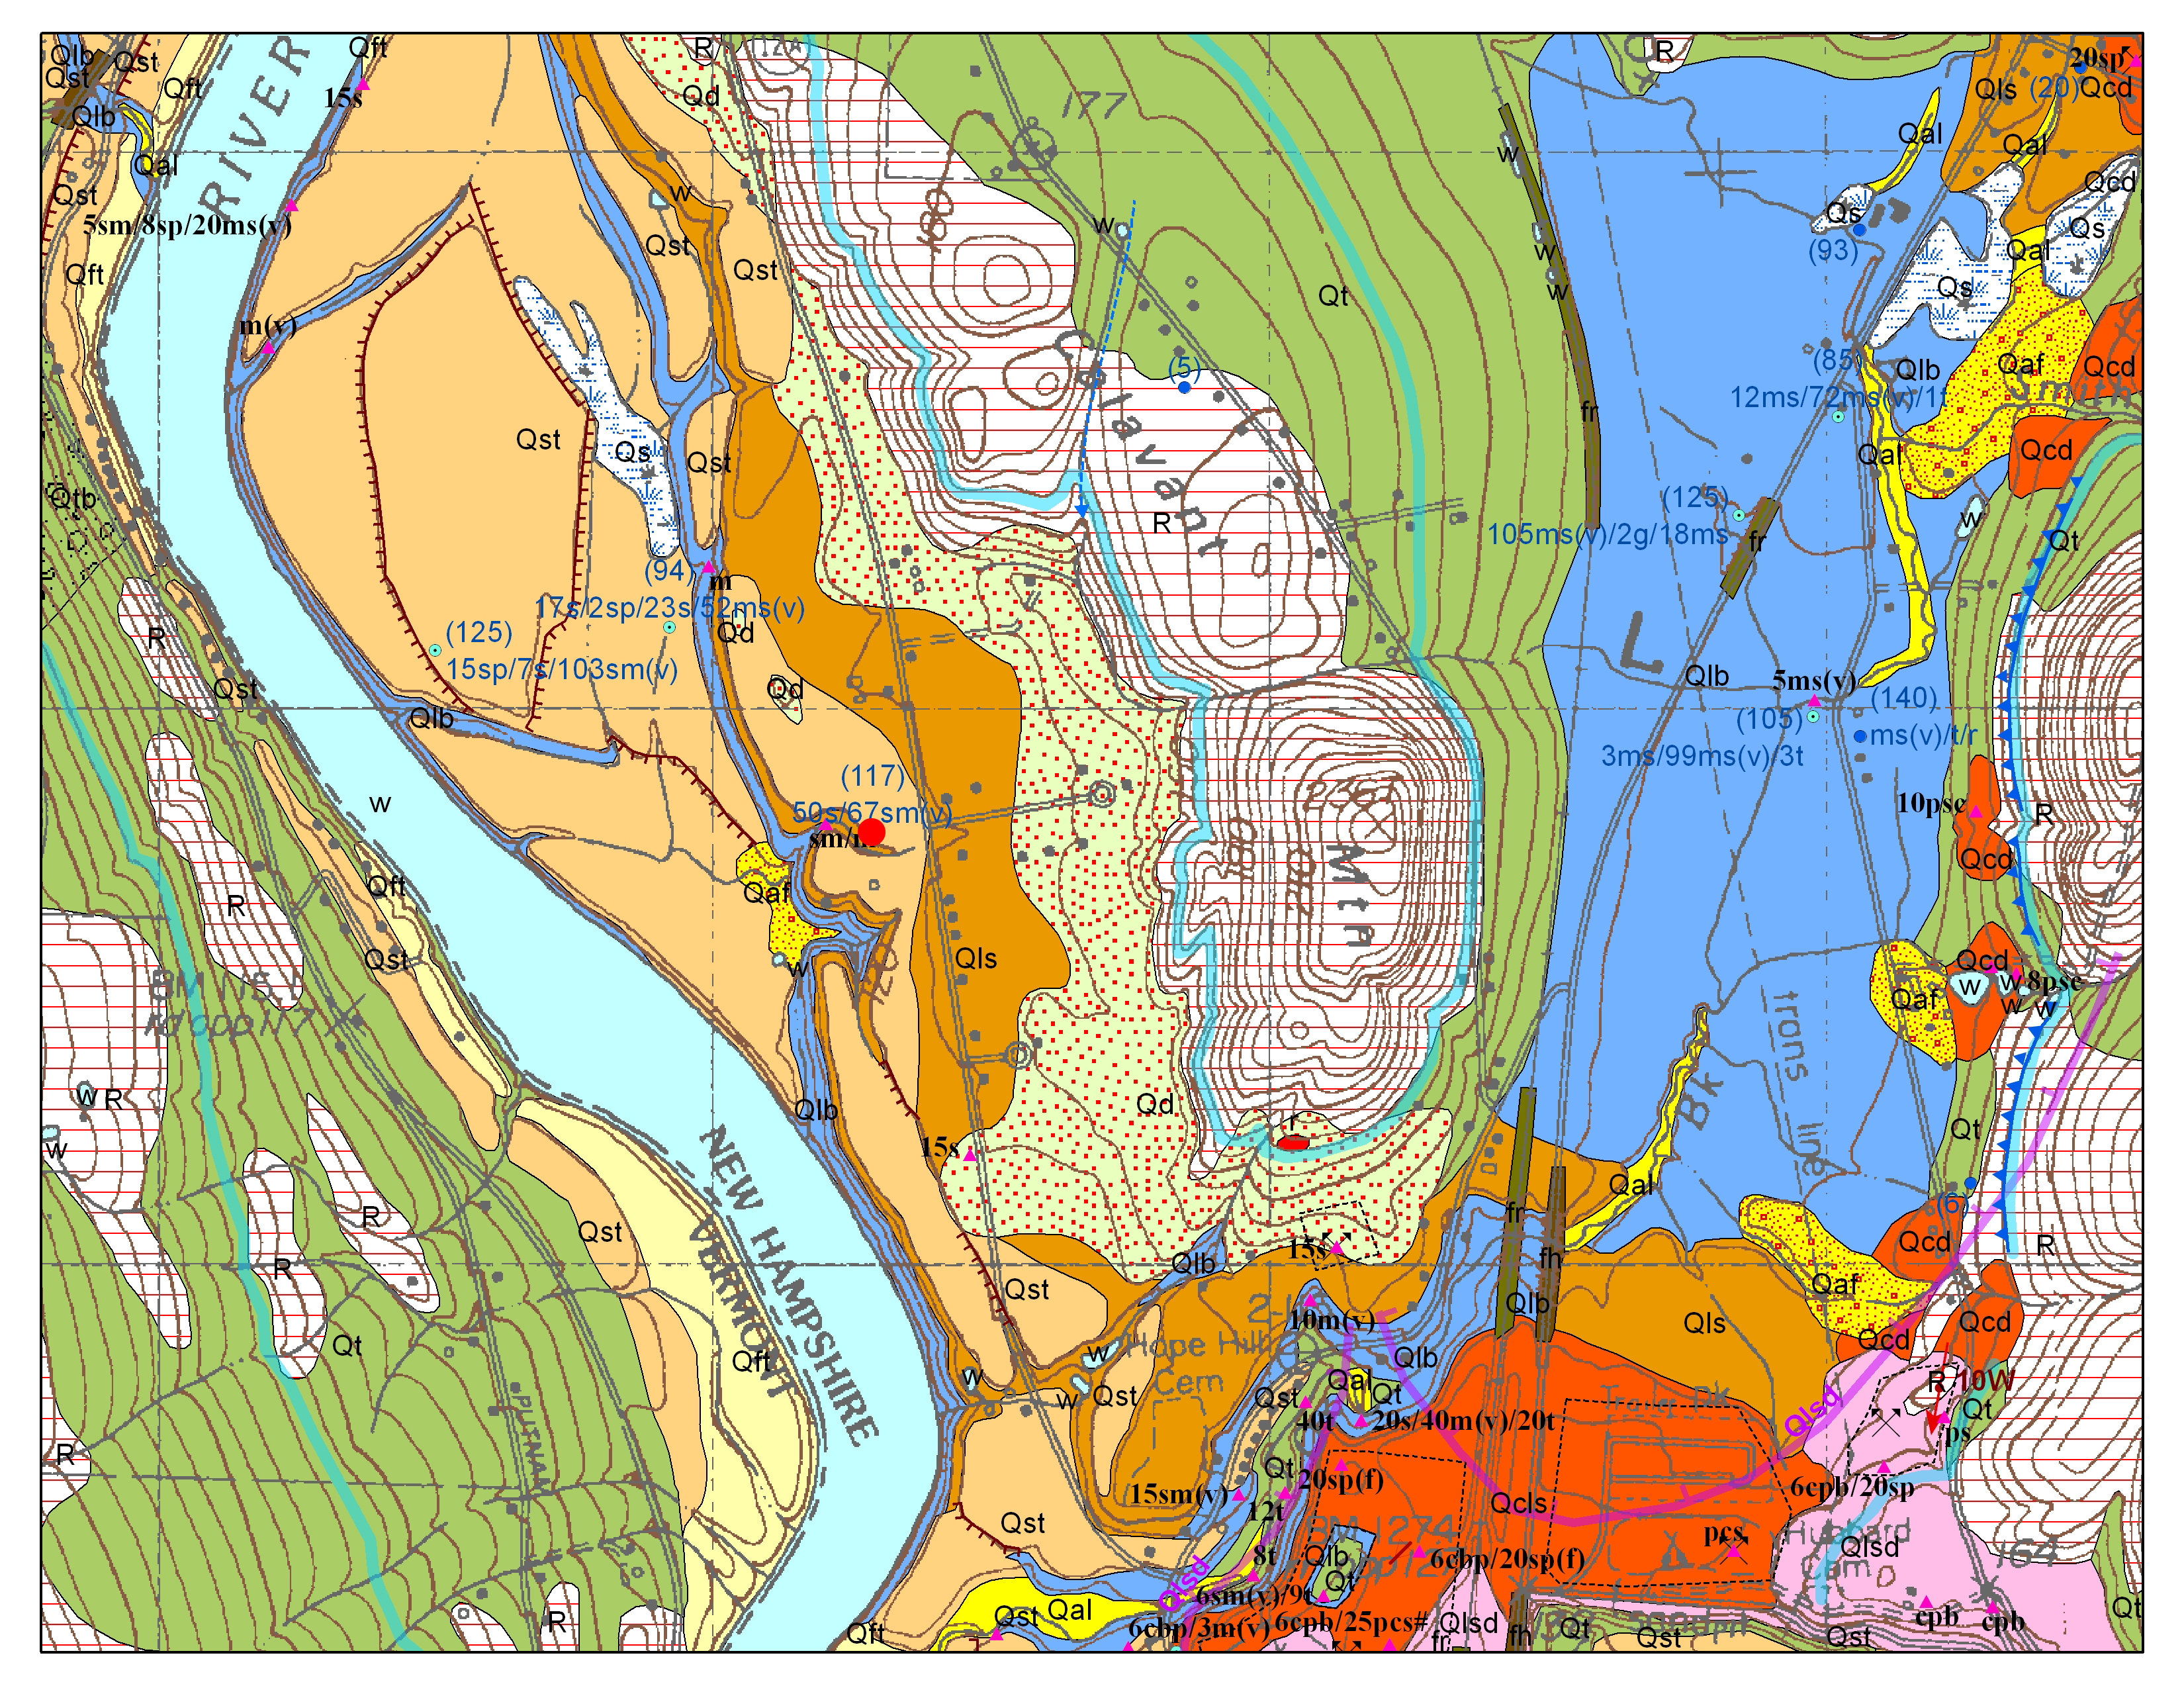
Surficial geologic map of the area near the Rt. 12A drill site (red filled circle in center of map). The large blue area on the map is the Perry Hill Basin. Varve sections from drill holes in this basin have been the subject of other varves of the month. Units on the map are: Qal = alluvium, Qaf = alluvial fans, Qcd = deltaic sand and gravel, Qd = eolian sand, Qft = modern flood terrace deposits, Qlb = fine sand, silt and clay lake bottom sediment, Qls = lacustrine sand, Qlsd = delta in local impoundment at mouth of Little Sugar River, Qst = stream terrace deposits, Qt = till, R and r = bedrock exposure. Symbols are: thick blue line = reconstructed shore of Lake Hitchcock, dark blue hachured line = wave cut scarp along shore of Lake Hitchcock, brown hachured lines = stream terrace scarps, blue dots (solid dark blue reach bedrock) = well records and borings, pink triangles with sediment descriptions = outcrop and sediment descriptions, red arrows = glacial striations.
The varves shown here are very sandy and get progressively less sandy and thinner downward, and sandier and thicker upward. Pulses of sand clearly show up in the summer layer of each varve. Near the top of each summer layer the very rhythmic alternating layers of sandy and clayey silt may represent diurnal pulses of sediment. This rhythmic character continues into the base of each winter layer. Winter layers are sharply truncated by the summer layers above.
Past Varves of the Month...
- 6/1/2008 - Connecticut Valley Varves at Canoe Brook, Dummerston, Vermont
- 4/27/2008 - Connecticut Valley Varves from Kelsey Ferguson Brickyard, Redland Brick Co., East Windsor, Connecticut.
- 7/1/2008 - Champlain Valley varves at Keesville, NY
- 8/1/2008 - Connecticut Valley Varves at Aldrich Brook, Westmoreland, New Hampshire
- 9/1/2008 - Connecticut Valley Varves, Perry Hill Basin (PHS), Charlestown, New Hampshire
- 10/1/2008 - Connecticut Valley Varves, Perry Hill Basin (PHN), Charlestown, New Hampshire.
- 11/1/2008 - Connecticut Valley Varves, Aldrich Brook site, Westmoreland, New Hampshire
- 12/1/2008 - Connecticut Valley Varves, Aldrich Brook site, Westmoreland, New Hampshire
- 1/1/2009 - Mine fire reclamation site, Olyphant, Pennsylvania
- 2/1/2009 - Connecticut Valley Varves, Perry Hill Basin (PHS), Charlestown, New Hampshire
- 3/1/2009 - Connecticut Valley Varves, Perry Hill Basin, Charlestown, New Hampshire
- 4/1/2009 - Connecticut Valley Varves, Perry Hill Basin, Charlestown, New Hampshire.
- 5/1/2009 - Connecticut Valley Varves, Perry Hill Basin, Charlestown, New Hampshire
- 6/1/2009 - Connecticut Valley Varves, Perry Hill Basin, Charlestown, New Hampshire
- 7/1/2009 - Connecticut Valley Varves, Perry Hill Basin, Charlestown, New Hampshire
- 8/1/2009 - Connecticut Valley Varves, Perry Hill Basin, Charlestown, New Hampshire
- 9/1/2009 - Connecticut Valley Varves, Perry Hill Basin, Charlestown, New Hampshire
- 10/1/2009 - Connecticut Valley Varves, Perry Hill Basin, Charlestown, New Hampshire
- 11/1/2009 - Connecticut Valley Varves, Perry Hill Basin, Charlestown, New Hampshire.
- 12/1/2009 - Connecticut Valley Varves, Perry Hill Basin, Charlestown, New Hampshire
- 1/1/2010 - Connecticut Valley Varves, Perry Hill Basin, Charlestown, New Hampshire
- 2/1/2010 - Varves along Starrucca Creek near Lanesboro, Pennsylvania
- 3/1/2010 - Varves in the Don Valley, Toronto
- 4/1/2010 - Varves along Sandy Stream, Dennistown Plantation near Jackman, Maine
- 5/3/2010 - Varves from Glacial Lake Great Falls in Montana
- 6/4/2010 - Varves from Charlestown, NH
- 7/1/2010 - Varves from Redlands Brick Co. (Kelsey Ferguson Brickyard, South Windsor, Connecticut) - A varve that Antevs missed
- 8/1/2010 - Varves from Glastonbury, Connecticut
- 9/1/2010 - Varves from North Hatfield, Massachusetts
- 10/1/2010 - Varves from Newbury, Vermont
- 11/1/2010 - Varves from Newbury, Vermont
- 12/1/2010 - Varves from Newbury, Vermont
- 2/1/2011 - Connecticut Valley Varves at North Hatfield, Massachusetts
- 3/1/2011 - Connecticut Valley Varves Kelsey Ferguson (Redlands Brick Co.), South Windsor, Connecticut
- 6/1/2011 - Connecticut Valley Varves: Core at Scantic, East Windsor, Connecticut
- 8/1/2011 - Varves of West Canada Creek Valley, western Mohawk Valley
- 10/1/2011 - Varves of West Canada Creek Valley, western Mohawk Valley collected in Newport, NY
- 12/1/2011 - Connecticut Valley Varves at Claremont Junction, NH
- 3/1/2012 - Connecticut Valley Varves at Westmoreland, NH