
Varves of the Month for 3/1/2012 - 7/1/2012
Connecticut Valley Varves at Westmoreland, NH

Scale bar in cm.
Click on image to download original image file
This month's image is an image stitched together from smaller high-resolution images of varves collected in cores at Westmoreland, NH (ALD – Aldrich Brook site). Each varve is labeled with its annual number in the new North American Varve Chronology (NAVC). The varves show a very rapid transition from relatively thin to relatively thick varves up section. This transition (red line on varve image), which occurred at about 14,600 yr BP (after NAVC--AM varve year 6228 on the image), represents the end of a cold interval in which end moraines were deposited near Charlestown, NH. The following warm interval was marked by very rapid ice recession from Charlestown to northern New Hampshire and Vermont for about 600 years at a rate of ~300 m/yr. This period was one of very rapid melting and meltwater delivery to Lake Hitchcock in the Connecticut Valley. This resulted in the deposition of varves with a thickness averaging about 3X greater than during the previous cool interval.
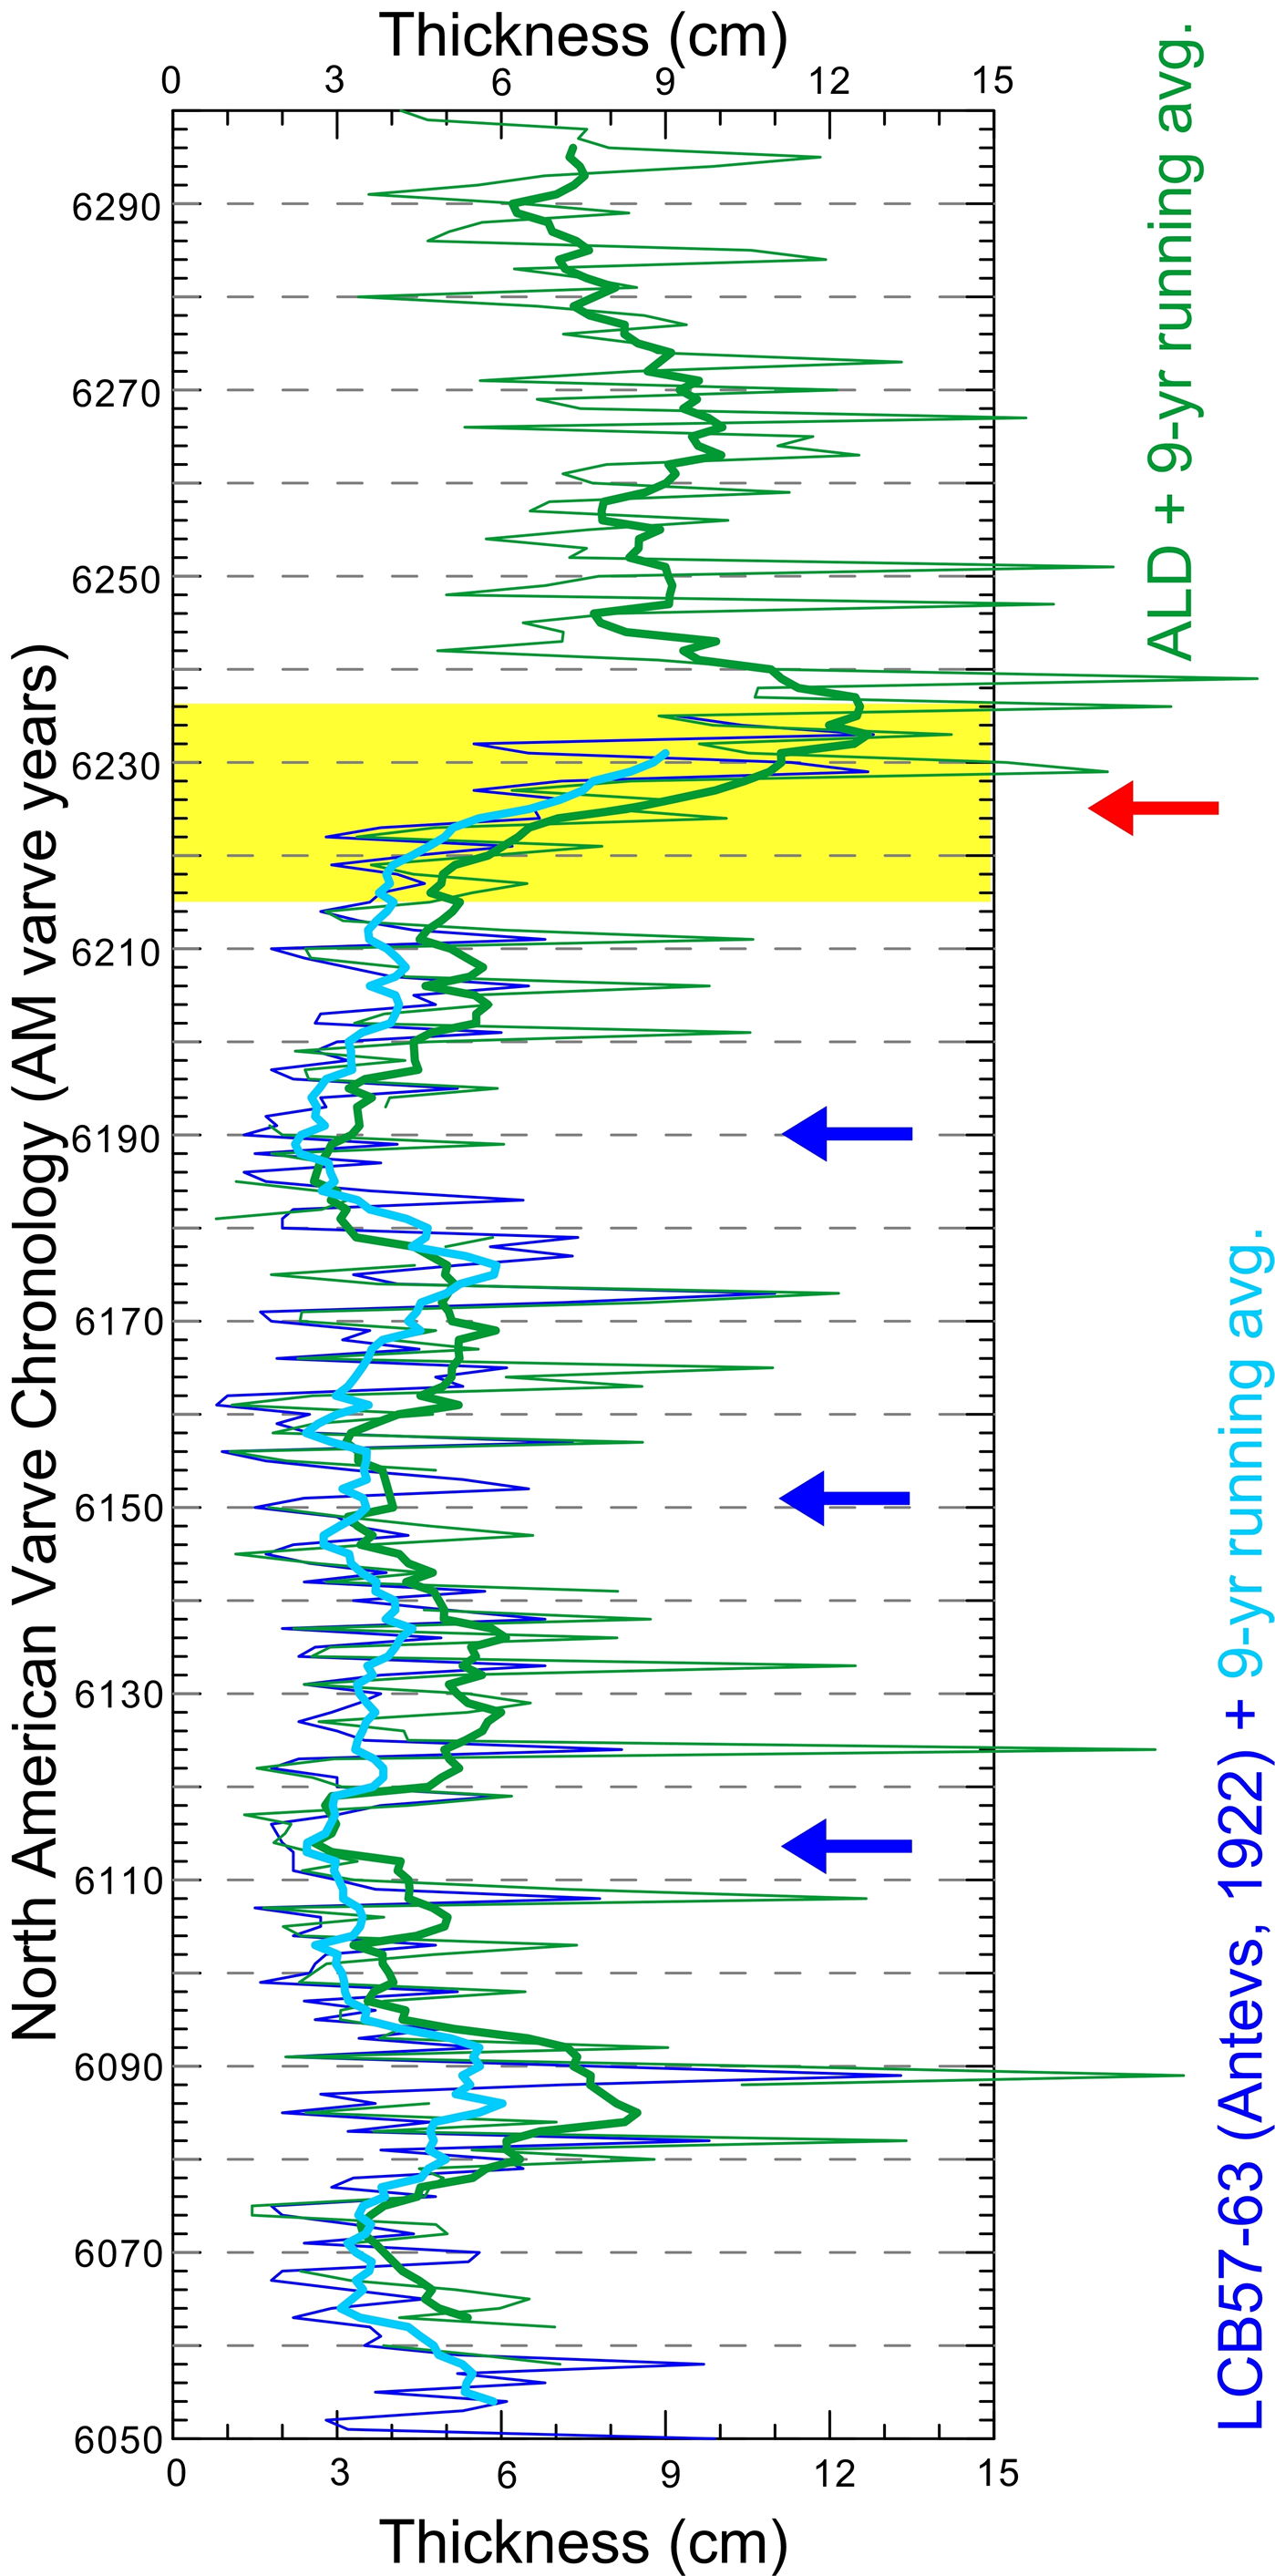
A correlation of the varve records from Antevs' (1922) chronology (LCB57-63) and Westmoreland, NH (ALD site) along with their 9-yr running averages. The yellow region is the span of time shown in the varve image. The blue arrows represent dips in meltwater delivery (thinner average varve thickness) that correspond to periods of end moraine building near Charlestown, NH. The red arrow represents the rapid transition from cold to warm conditions following end moraine building.
Past Varves of the Month...
- 6/1/2008 - Connecticut Valley Varves at Canoe Brook, Dummerston, Vermont
- 4/27/2008 - Connecticut Valley Varves from Kelsey Ferguson Brickyard, Redland Brick Co., East Windsor, Connecticut.
- 7/1/2008 - Champlain Valley varves at Keesville, NY
- 8/1/2008 - Connecticut Valley Varves at Aldrich Brook, Westmoreland, New Hampshire
- 9/1/2008 - Connecticut Valley Varves, Perry Hill Basin (PHS), Charlestown, New Hampshire
- 10/1/2008 - Connecticut Valley Varves, Perry Hill Basin (PHN), Charlestown, New Hampshire.
- 11/1/2008 - Connecticut Valley Varves, Aldrich Brook site, Westmoreland, New Hampshire
- 12/1/2008 - Connecticut Valley Varves, Aldrich Brook site, Westmoreland, New Hampshire
- 1/1/2009 - Mine fire reclamation site, Olyphant, Pennsylvania
- 2/1/2009 - Connecticut Valley Varves, Perry Hill Basin (PHS), Charlestown, New Hampshire
- 3/1/2009 - Connecticut Valley Varves, Perry Hill Basin, Charlestown, New Hampshire
- 4/1/2009 - Connecticut Valley Varves, Perry Hill Basin, Charlestown, New Hampshire.
- 5/1/2009 - Connecticut Valley Varves, Perry Hill Basin, Charlestown, New Hampshire
- 6/1/2009 - Connecticut Valley Varves, Perry Hill Basin, Charlestown, New Hampshire
- 7/1/2009 - Connecticut Valley Varves, Perry Hill Basin, Charlestown, New Hampshire
- 8/1/2009 - Connecticut Valley Varves, Perry Hill Basin, Charlestown, New Hampshire
- 9/1/2009 - Connecticut Valley Varves, Perry Hill Basin, Charlestown, New Hampshire
- 10/1/2009 - Connecticut Valley Varves, Perry Hill Basin, Charlestown, New Hampshire
- 11/1/2009 - Connecticut Valley Varves, Perry Hill Basin, Charlestown, New Hampshire.
- 12/1/2009 - Connecticut Valley Varves, Perry Hill Basin, Charlestown, New Hampshire
- 1/1/2010 - Connecticut Valley Varves, Perry Hill Basin, Charlestown, New Hampshire
- 2/1/2010 - Varves along Starrucca Creek near Lanesboro, Pennsylvania
- 3/1/2010 - Varves in the Don Valley, Toronto
- 4/1/2010 - Varves along Sandy Stream, Dennistown Plantation near Jackman, Maine
- 5/3/2010 - Varves from Glacial Lake Great Falls in Montana
- 6/4/2010 - Varves from Charlestown, NH
- 7/1/2010 - Varves from Redlands Brick Co. (Kelsey Ferguson Brickyard, South Windsor, Connecticut) - A varve that Antevs missed
- 8/1/2010 - Varves from Glastonbury, Connecticut
- 9/1/2010 - Varves from North Hatfield, Massachusetts
- 10/1/2010 - Varves from Newbury, Vermont
- 11/1/2010 - Varves from Newbury, Vermont
- 12/1/2010 - Varves from Newbury, Vermont
- 2/1/2011 - Connecticut Valley Varves at North Hatfield, Massachusetts
- 3/1/2011 - Connecticut Valley Varves Kelsey Ferguson (Redlands Brick Co.), South Windsor, Connecticut
- 6/1/2011 - Connecticut Valley Varves: Core at Scantic, East Windsor, Connecticut
- 8/1/2011 - Varves of West Canada Creek Valley, western Mohawk Valley
- 10/1/2011 - Varves of West Canada Creek Valley, western Mohawk Valley collected in Newport, NY
- 12/1/2011 - Connecticut Valley Varves at Claremont Junction, NH
- 7/1/2012 - Connecticut Valley Varves at Rt. 12A drill site in North Charlestown, N.H.