
NAVC and Connecticut Valley Lake Stages
The NAVC in the Connecticut Valley has abrupt changes in varve thickness that are maintained for at least a decade or more. These positions in the varve chronology may represent times of lake level change or if varve thickness is not maintained for very long they may represent flood events into the Connecticut Valley from the release of water in tributary lakes.
The initial Connecticut Valley lake levels during ice recession in northern Connecticut were the first stages of glacial Lake Hitchcock. These lakes eventually developed a high stable level draining to a spillway in New Britain, Connecticut. At Rocky Hill, Connecticut a large mass of ice-contact stratified sediment blocked the Connecticut Valley forming the lake's dam. When this high stable level of Lake Hitchcock dropped to a lower lake level, which was also stable , is not conclusively known yet and remains a point of controversy. At some point a lower stable version of Lake Hitchcock was established and drained through sediment that formed the original dam at Rocky Hill for the initial high stable level. This lake level drop may have been a subtle event and might not be represented by a conspicuous change in varve thickness since water levels only fell about 8-10 meters. Deltas of the second stable level occur throughout the Connecticut Valley of New Hampshire and Vermont and at the mouths of some tributaries in northern Massachusetts. In New Hampshire and Vermont this lake has been informally called the Cold River Stage after a large delta at the mouth of the Cold River in Walpole, NH.
In the Connecticut Valley north of Claremont, NH lake water persisted in the valley after the drainage of the Cold River Stage and sediment from these lower unnamed lake stages has been cored in the Passumpsic Valley and at Newbury, VT and at North Haverill and Hanover, NH. At this point not much is known about the spillways and chronology of these postglacial lake stages that are represented by non-glacial varves. At this point it does not appear that any of these lakes extended south of Claremont, NH.
There appear to be four major changes in varve thickness that could represent lake level changes. These events are listed on the table below and shown in the varve chronology plots and images beneath the table. Click on a linked varve year event or a panel tab below the table to view event details.
NAVC (AM) varve year |
NEVC (NE) varve year |
Position of receding ice front |
Notes |
|---|---|---|---|
{NEVC} |
{Position} |
{Notes} |
A core from North Hatfield, Massachusetts shows an abrupt change to thicker varves that may represent a change in lake level, perhaps the transition from the high stable level of Lake Hitchcock to the lower stable level (Cold River Stage). If this is true the transition would have taken place when the receding ice front was between North Hatfield and Turners Falls, Massachusetts. An alternative hypothesis at North Hatfield is that the ice sheet readvanced to near this position and forced the increase in varve thickness as an ice-proximal environment was imposed on the core site. Varve thickness after the event is erratic with groups of thick varves after the event (see plot) perhaps suggestive of approaching ice and a dynamic ice-proximal environment. A change in varve thickness is also seen in Antevs' normal curve (MAS37-53, Antevs, 1922) and the UMass core (UMass46-61, Rittenour, 1999) but the thickness change is more subtle, although these other records do document the widespread occurrence of the event.
A change to thicker varves occurs in the middle of flood events from the Ammonoosuc Valley seen here in cores from Newbury, VT. The two cores shown here overlap with the top varve on the left core matching the bottom varve on the right core. Prior to the flood events varves are very thin (bottom of left core). After the 3rd flood event (arrow) varve thickness is ~3X thicker than before the flood events. This greater thickness is maintained after the final flood event and seen over a wide area suggesting that a permanent change in varve deposition has occurred. Climate change to warming and more rapid glacial melting beginning at ~AM 6925 may also have contributed to the increase in varve thickness but later than the event shown here.
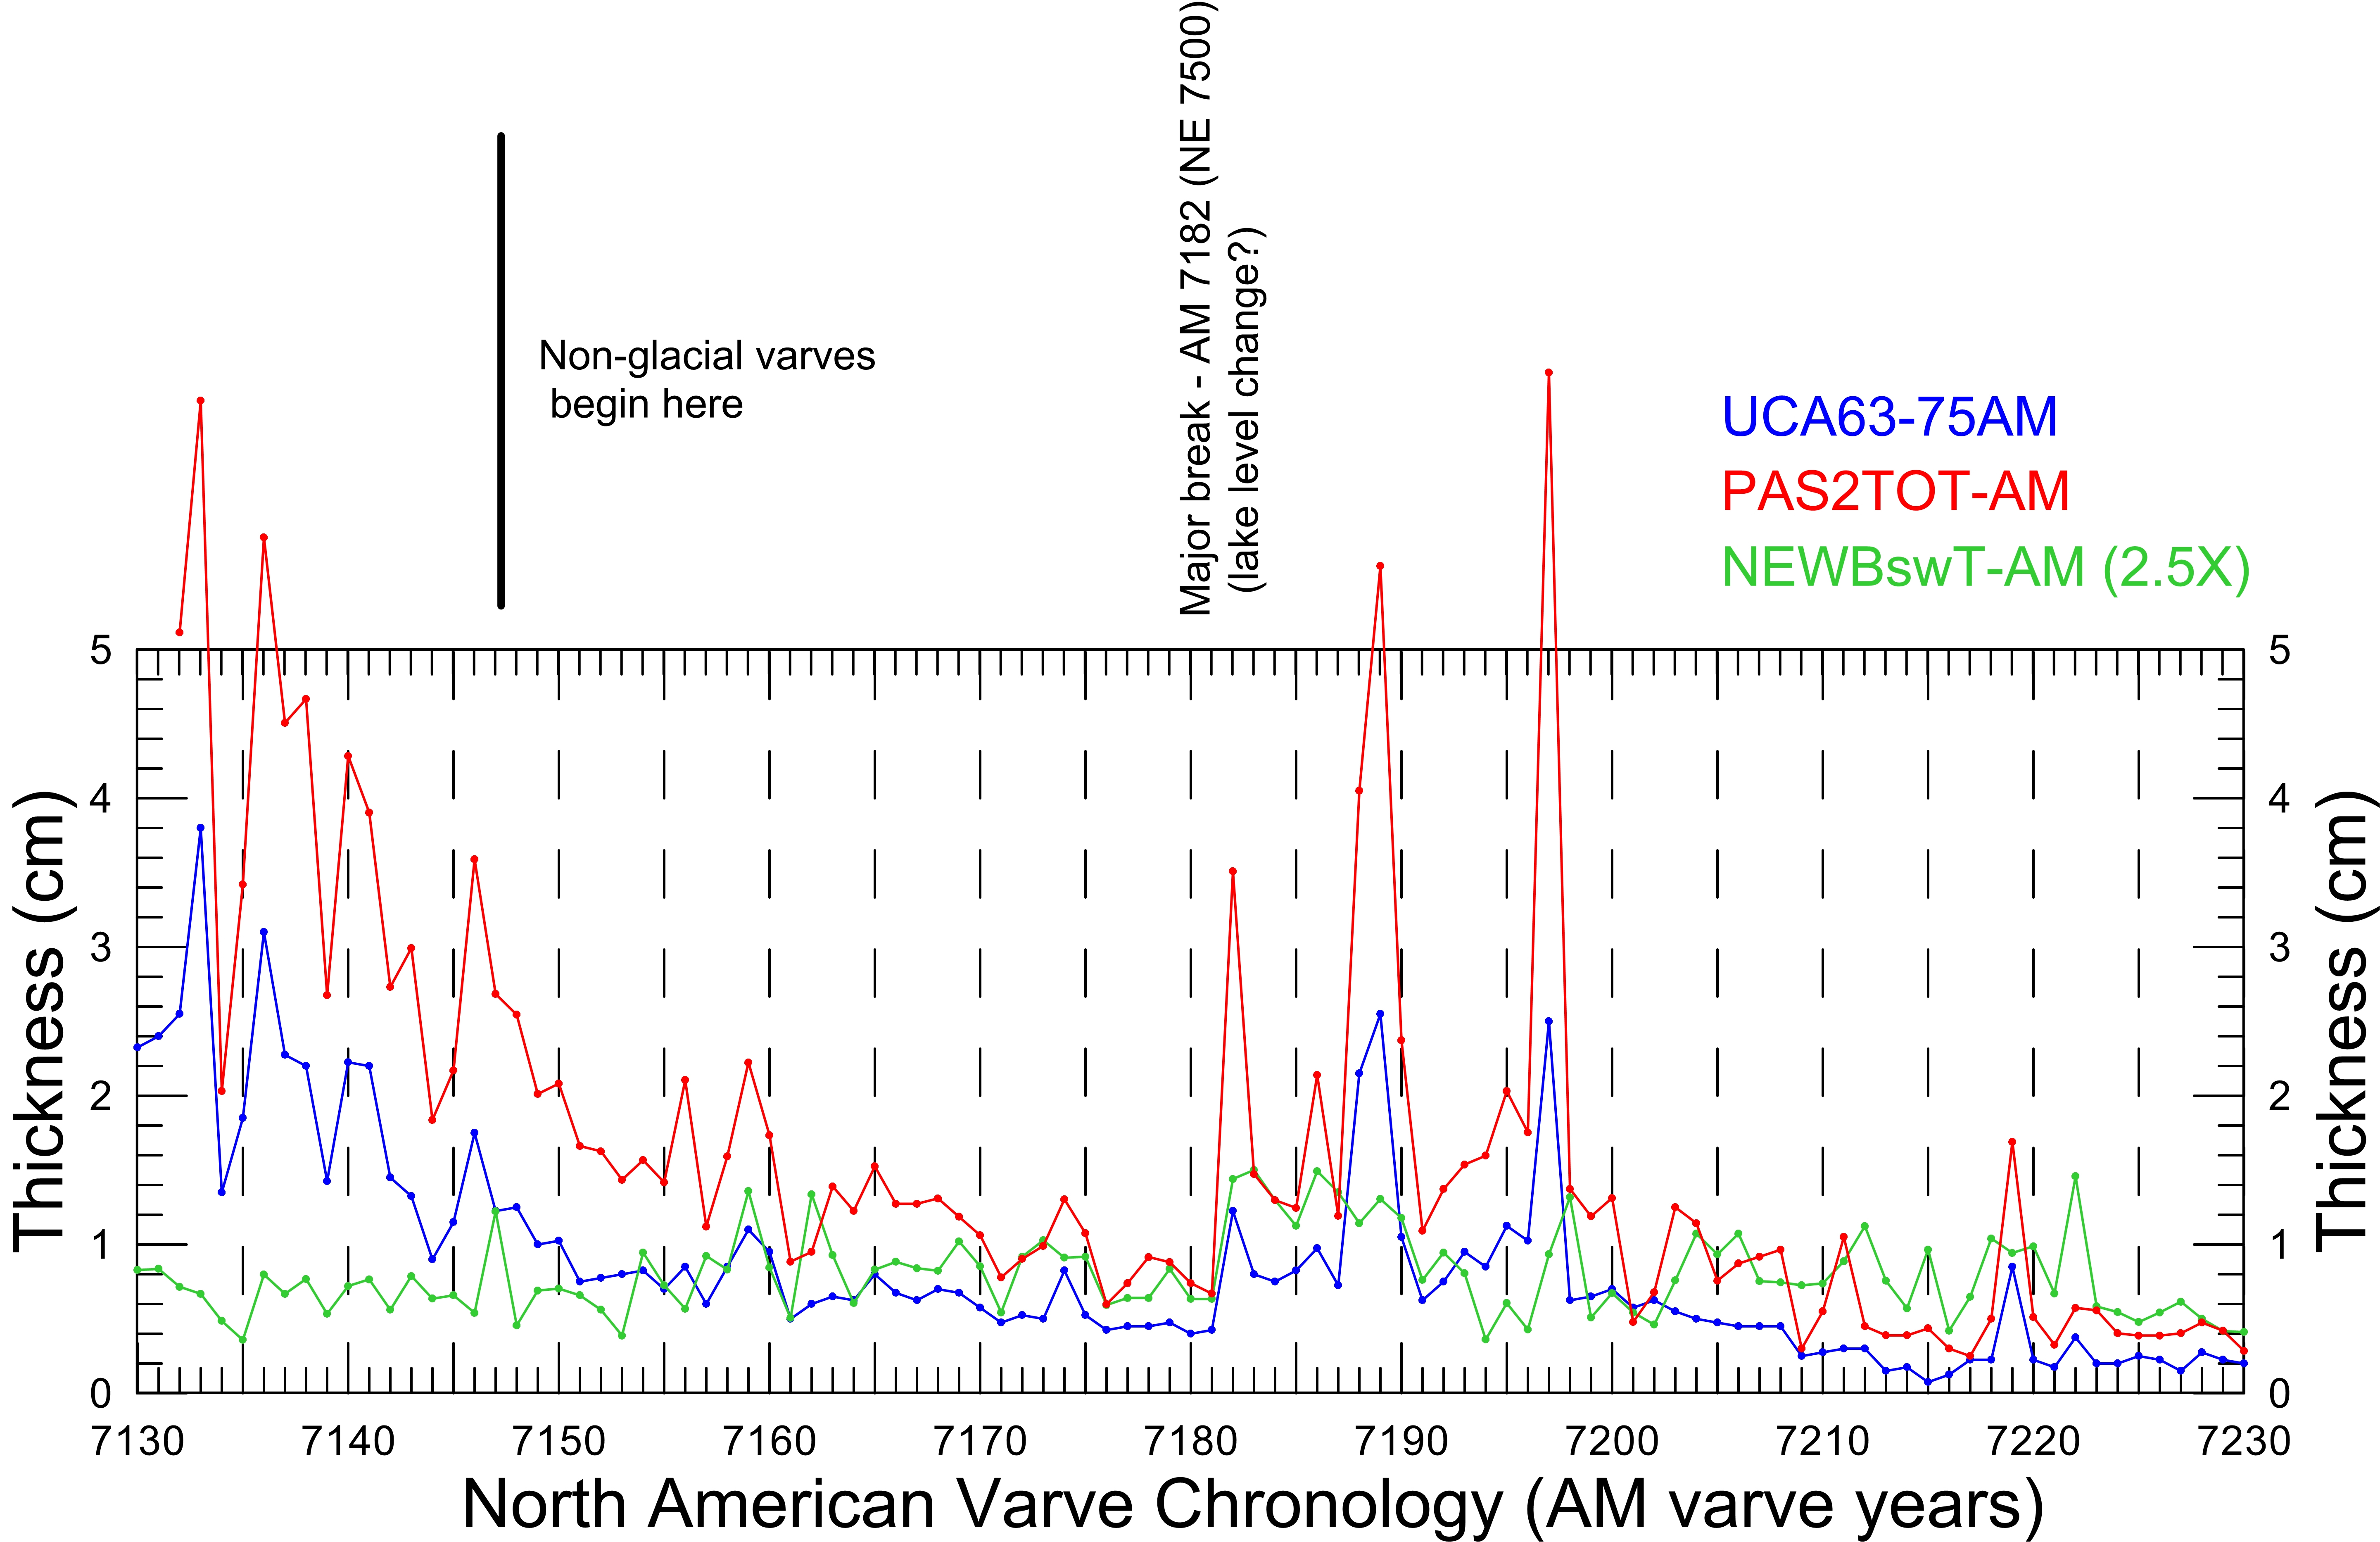
The change to thicker varves at this time shows up in non-glacial varves on the core image from Newbury, VT with conspicuous white summer layers and thicker winter layers (arrows). This thickness change is only maintained for 2 decades and may represent the dissipation of a flood event from a lake up valley (Lake Coos or Colebrook?). The thickness change is widespread and also shows up in Antevs' (1928) normal curve for the upper Connecticut Valley (UCA63-75) and an outcrop record in the Passumpsic Valley, which are plotted below.
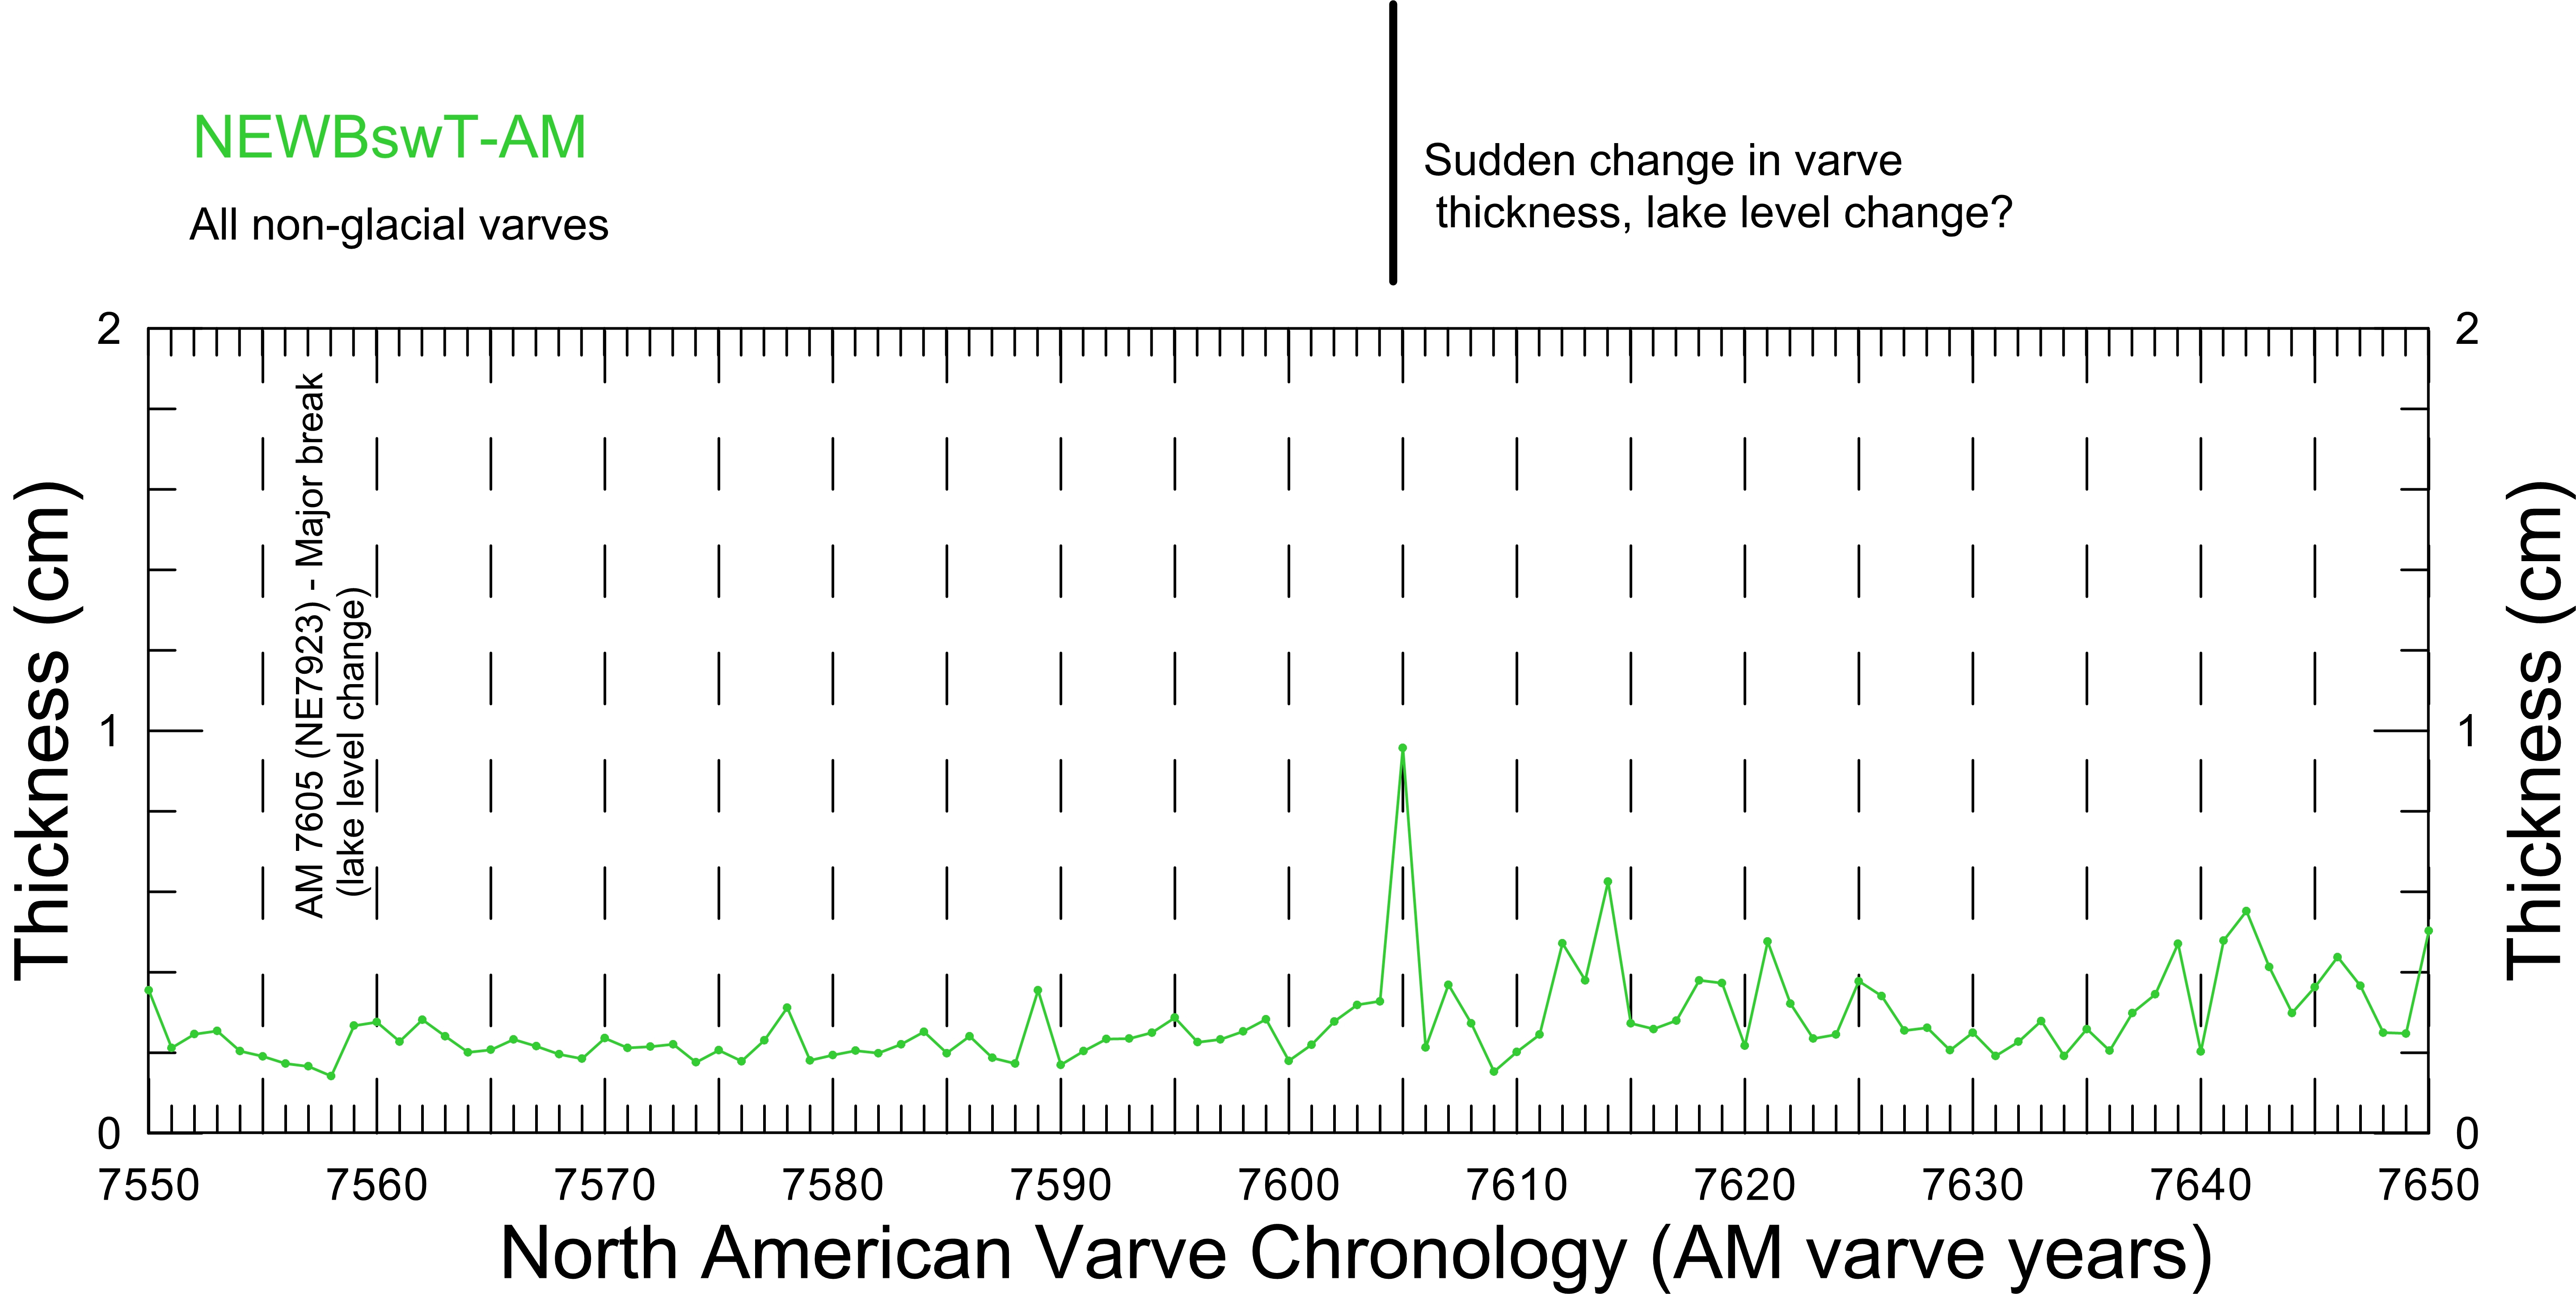
The change to thicker and sandier varves at this time is very conspicuous in the core image of non-glacial varves from Newbury, VT and has also been found in a core from Occum Pond on the Dartmouth University campus, Hanover, NH. This thickness change is maintained for 2 centuries and coincidentally corresponds to the beginning of a prominent climatic cooling event (Intra-Allerød Cooling Pulse or Greenland Interstadial GI-1b). The sudden change in varve thickness seems to be too abrupt to be solely the result of a response by a non-glacial system to climate change and therefore likely corresponds to an abrupt lake level change event in addition to climate change.