
The North American Varve Chronology Calibration (Last Updated August, 2016)
by Jack Ridge (Tufts University) and Greg Balco (Berkeley Geochronology Center)
Introduction
Presented below is the calibration of the North American varve Chronology (NAVC). Prior to this calibration, in published versions (Ridge, 2003, 2004) and on this web site for the New England Varve Chronology (NEVC), calibration of the lower and upper Connecticut NEVC varve sequences was based on many fewer radiocarbon ages and used older versions of the CALIB calibration program (CALIB 5.01) and IntCal data set (IntCal04, IntCal09). The consolidation of the lower and upper Connecticut sequences, the incorporation of corrections to the old NEVC, and many additional radiocarbon ages (Ridge et al., 2012), allows a single calibration with radiocarbon ages that span about 4800 NAVC varve years using the newest version of CALIB (CALIB7.04) and the IntCal13 data set.
In earlier calibrations (Ridge, 2003, 2004; NEVC section of this web site) radiocarbon ages were converted to median calibrated years and then a linear regression analysis was performed on the varve year vs. calibrated age data. The input of median ages to a linear regression analysis, while ignoring their probability distributions, may have represented a reasonable calibration estimate but violated statistical principles associated with linear regression. In addition, the data set was composed of clusters of data, a less than ideal situation for linear regression. Any existing uneven distribution of radiocarbon samples in the varve chronology is unavoidable. Unfortunately, organic samples in glacial varves are somewhat rare and must be analyzed wherever possible making an even sample distribution through time difficult to achieve.
General Calibration Strategy
The statistical analysis used here recognizes that NAVC and calibrated years have the same relationship to radiocarbon years, only being different in terms of a consistent offset between the NAVC and calibrated time scales. In other words the calibrated and NAVC time scales are measuring the same thing relative to radiocarbon years and are simply defining their �0� years differently. The NAVC �0� varve yr can be defined as representing a certain calibrated year and this represents the offset between the two time scales. This analysis uses a much simpler strategy than in previous calibration attempts by not requiring the calibration of individual radiocarbon ages. This analysis was first employed with IntCal09 (Ridge et al., 2012) using 54 radiocarbon ages spread across 4800 years of the NAVC and here is updated with IntCal13. It simply finds the best fit between the IntCal13 calibration data set (calibrated vs. radiocarbon years; Reimer et al., 2013) and the NAVC radiocarbon data set (NAVC vs. radiocarbon years) assuming that varve years and calibrated years have the relationship of 1 cal yr = 1 varve yr with an offset in the numbering systems of the two time scales. Shown below is a plot of the IntCal13 data set for the approximate age range of the NAVC. The IntCal13 data set is mostly based on the radiocarbon dating of tropical corals, which have also been dated using U-Th methods, and radiocarbon-dated tree ring chronologies. The IntCal13 data set is available at: http://calib.qub.ac.uk/).
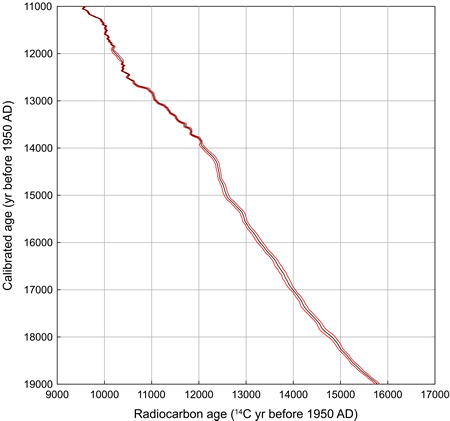
: Plot of the IntCal13 data set (black; Reimer et al., 2013) with its reported +/- 1-sigma uncertainties (red) of radiocarbon ages. Note that this plot is not linear and that radiocarbon years are younger than calibrated years.
Radiocarbon Ages
There are presently 53 radiocarbon ages of plant fossils plus one radiocarbon age of a snail shell from varves that have been matched to the NAVC in the Connecticut Valley. There are also 3 ages from varves that have not been matched to the NAVC. For a complete listing of all radiocarbon ages from varves in the Connecticut Valley see: Data & Downloads: Radiocarbon Ages. Below is a plot of the radiocarbon ages and their varve years in the NAVC.
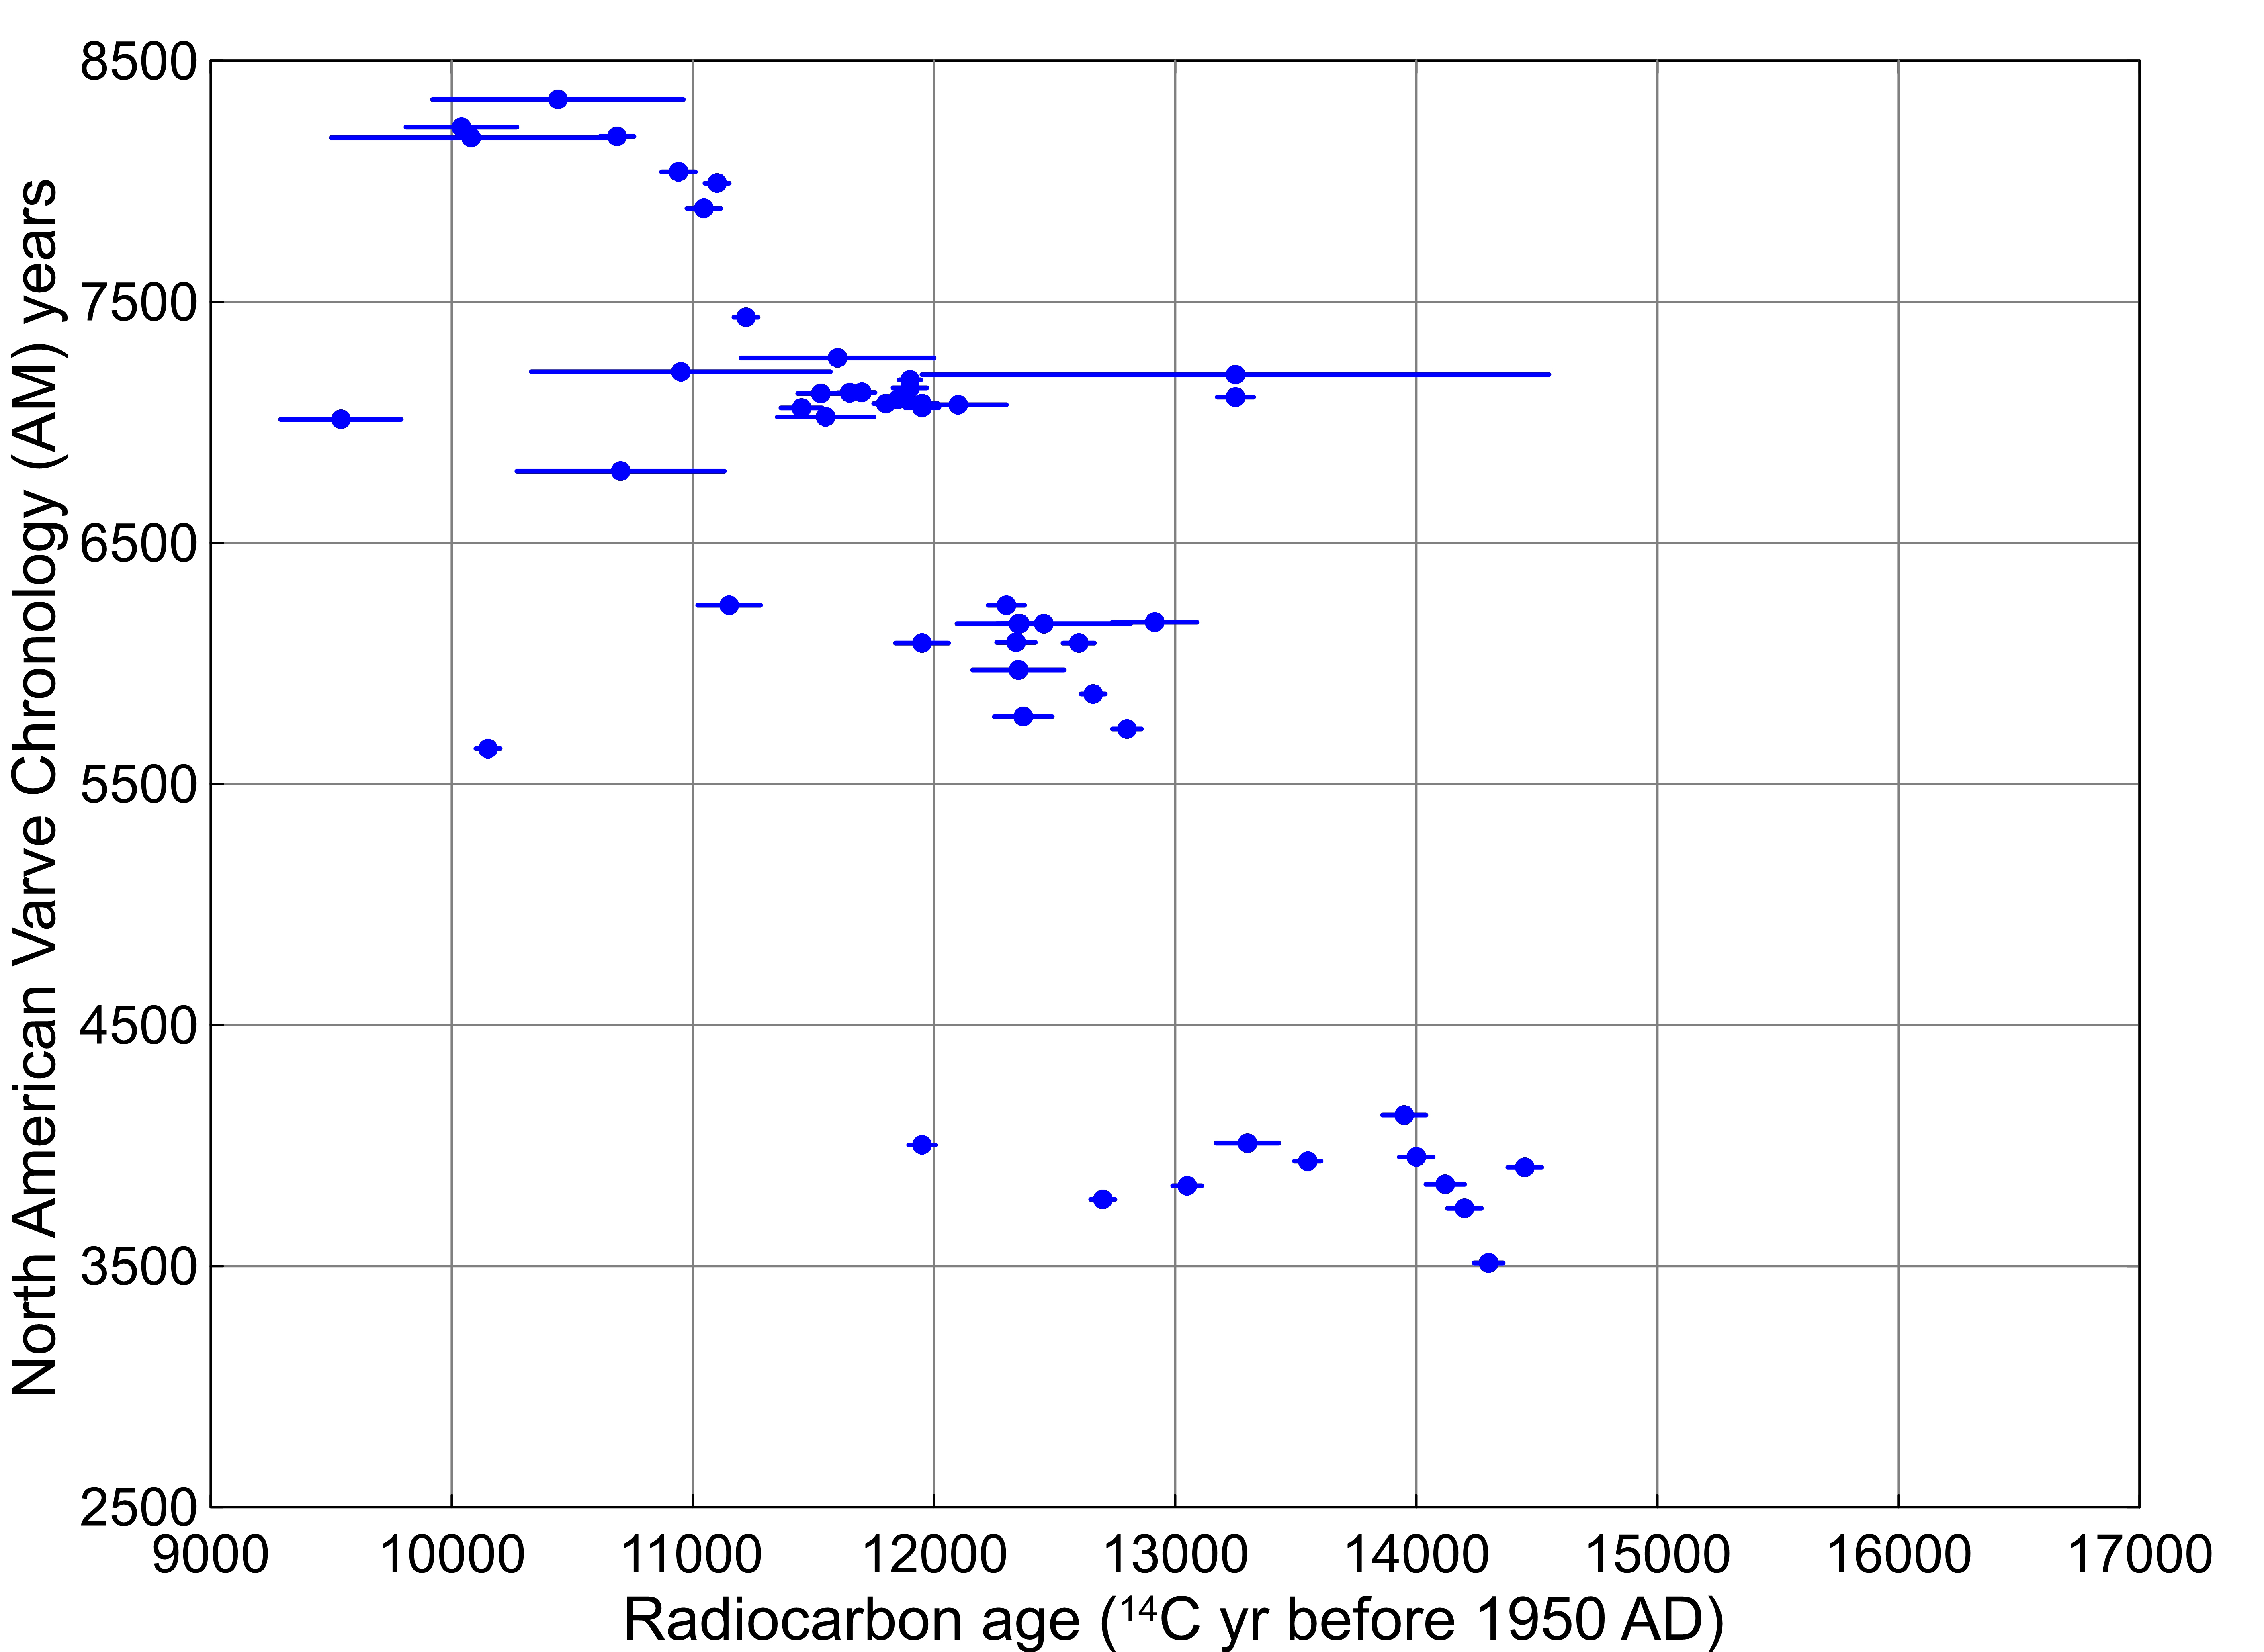
Plot of NAVC radiocarbon ages and 1-sigma uncertainties as reported by radiocarbon labs. Some of the plotted ages lie on top of each other. Click to download high resolution plot (~1MB)
Calibration Technique and Statistics (Using InCal13)
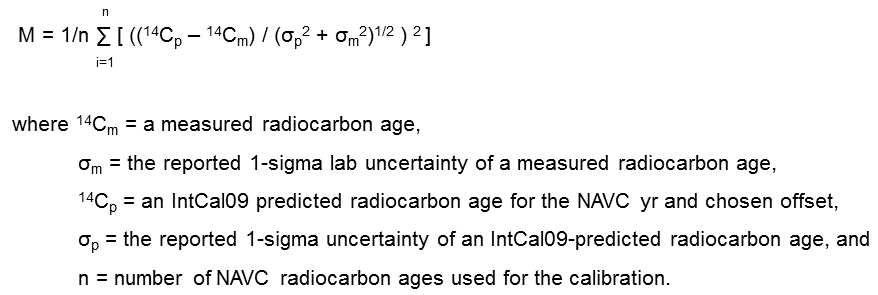
The strategy employed for calibration is to find the best fit between the radiocarbon data set for the NAVC (AM years vs. radiocarbon ages ) and the IntCal13 data set (cal yr vs. radiocarbon yr). This simply means finding the offset between NAVC and calibrated years that provides the best fit of the two data sets. The offset is simply the calibrated age of the NAVC �0� varve yr. In equation form, the translation of AM varve years to calibrated years is:
Shown above is a plot of NAVC (AM) years vs. radiocarbon ages for the Connecticut Valley and below is a plot of the IntCal13 data set for offsets for every 1000 yr from 18,000 to 23,000 cal yr. It is clear that an offset of 18,000 is too low since all points fall above this line and 23,000 is too high since all points fall below this line on the plot. The best-fit offset value is somewhere between 20,000 and 21,000 cal yr. The best fit offset can be obtained by moving the IntCal13 plot vertically on the graph until the position with minimal difference with the NAVC data set is found.
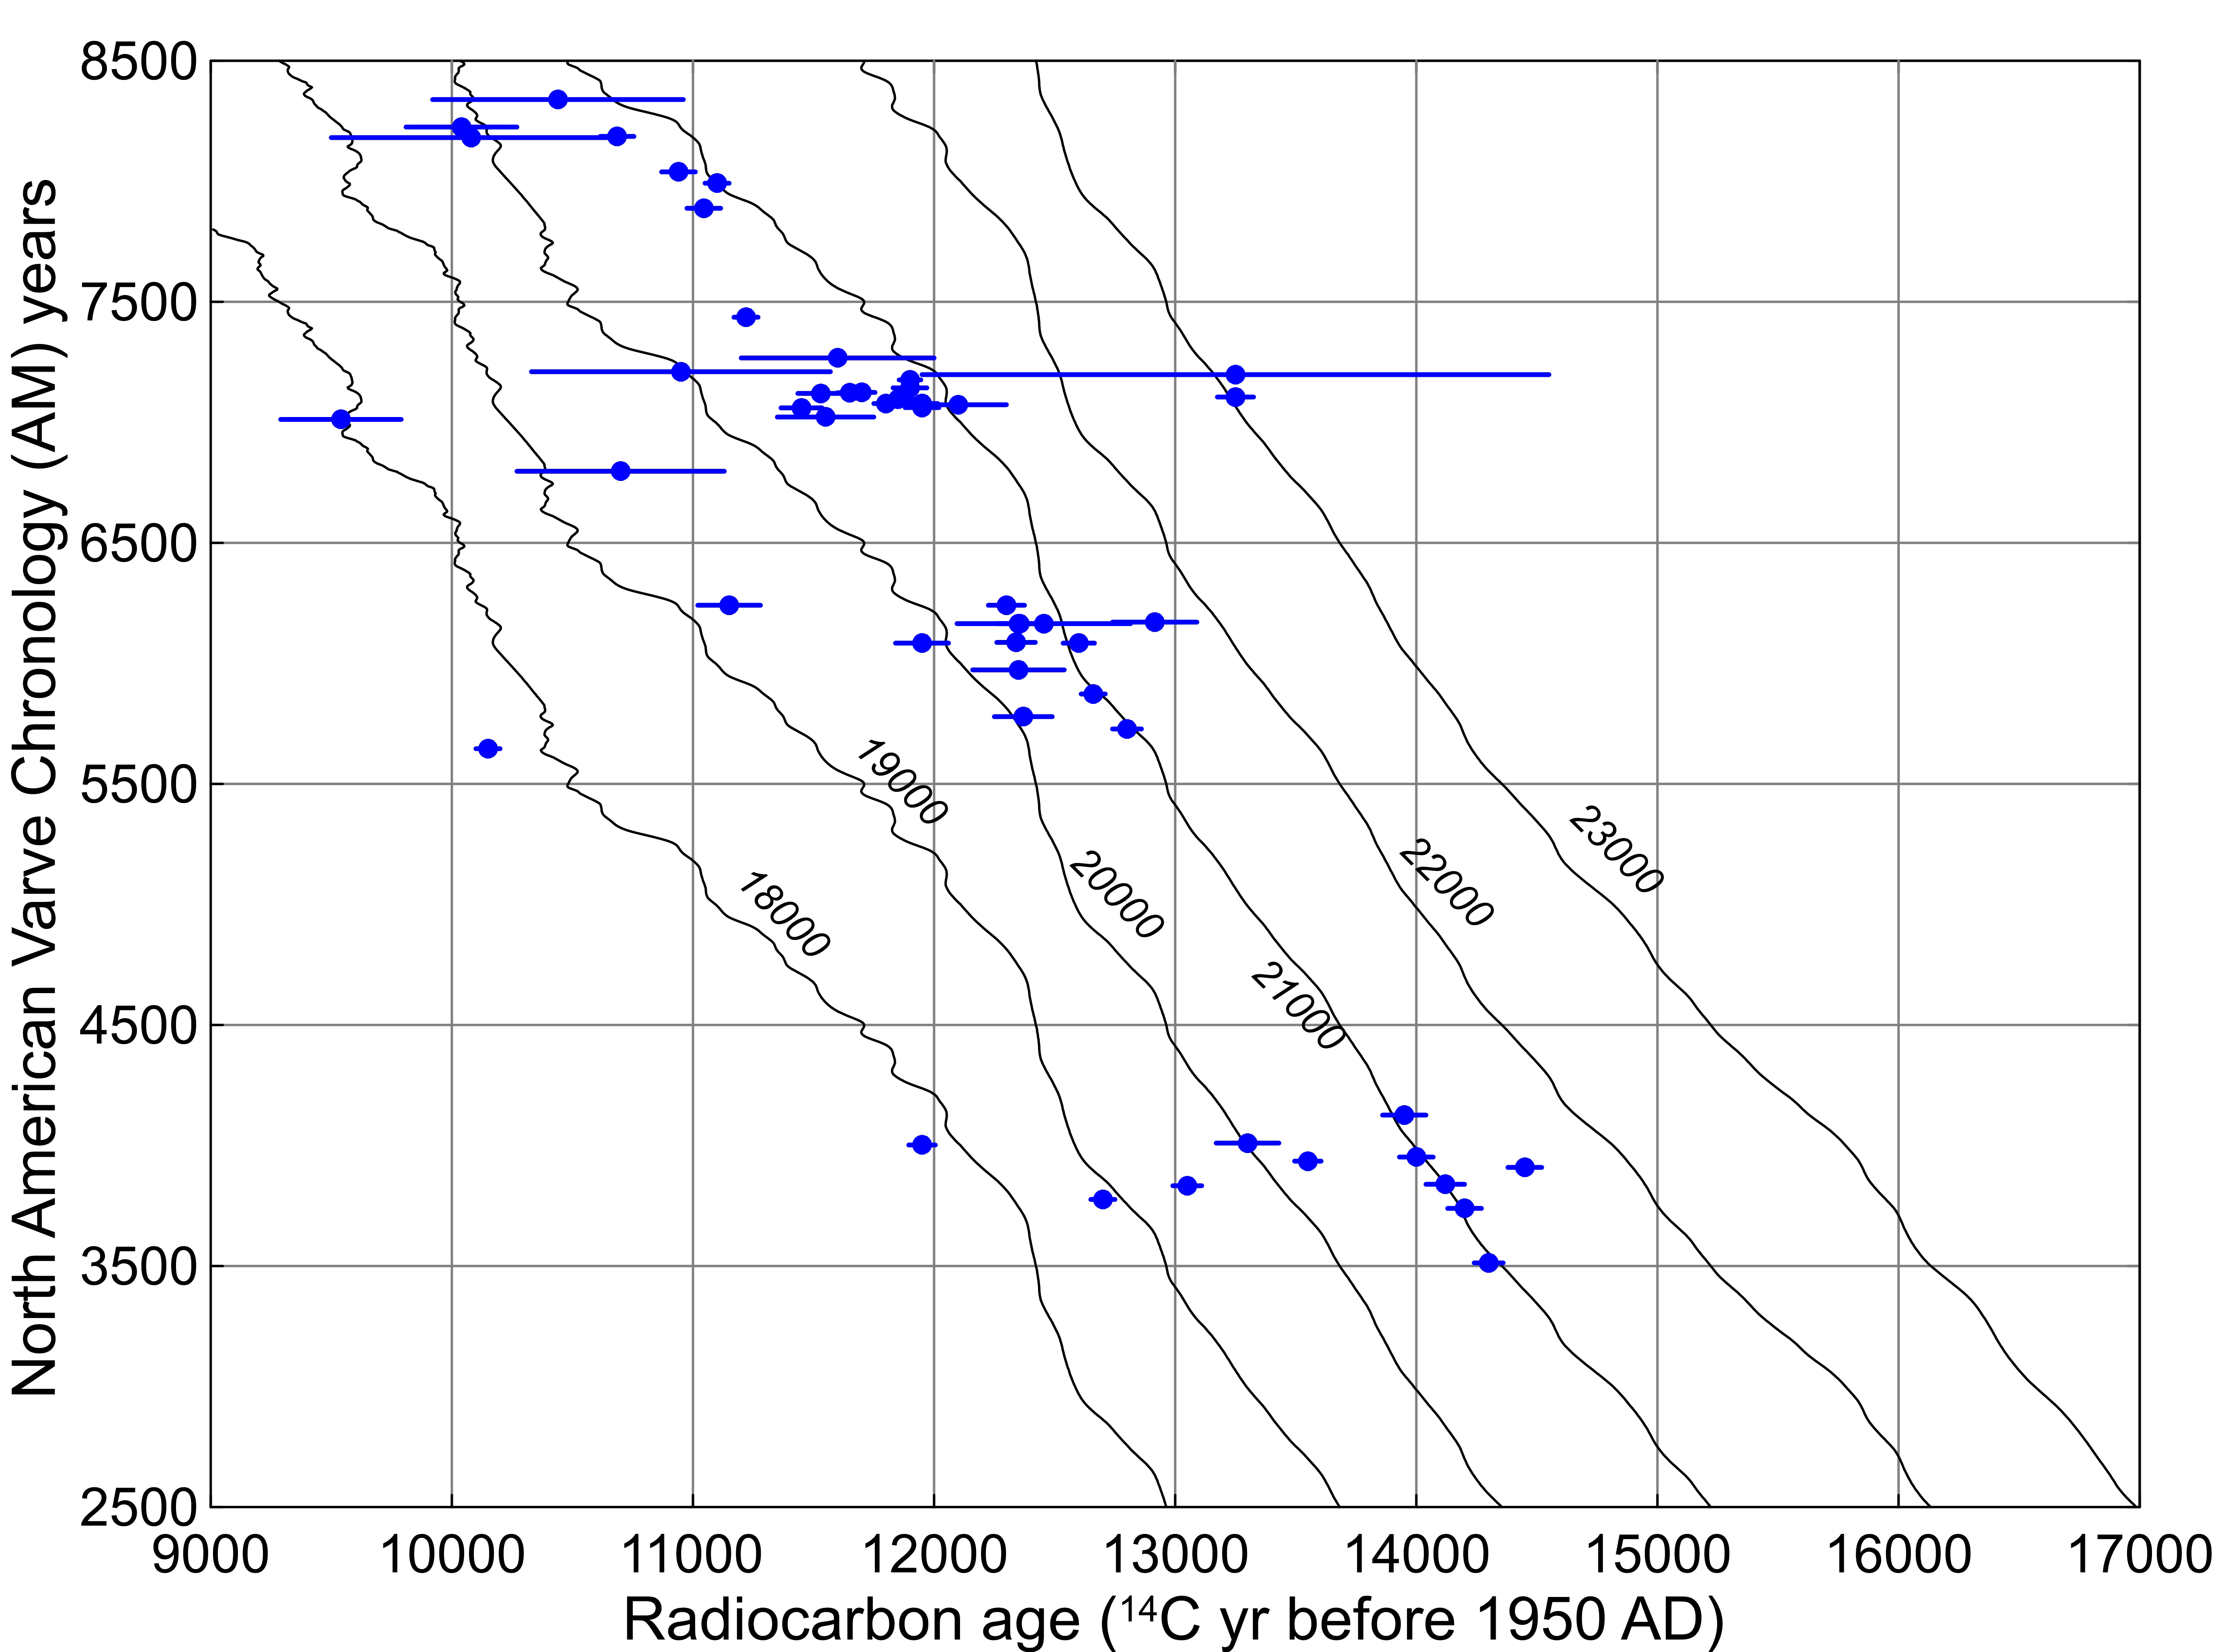
Plot of NAVC radiocarbon ages and 1-sigma uncertainties with plots of the IntCal13 data set in NAVC (AM) varve years using various offsets (calibrated ages of NAVC �0� varve).
To determine the best-fit offset value a goodness-of-fit statistic (M, mean square of weighted deviations) can be used to test possible offset values against each other. The offset that minimizes the value of M is the best-fit offset. For a particular offset value the formula for the goodness-of-fit statistic (M) is:
Predicted radiocarbon ages were determined through interpolation in the IntCal13 data set using the calibrated value determined from a particular offset of the NAVC varve time scale. The best-fit offset value is the offset with the lowest goodness-of-fit (M) value. The analysis below has calculated the M value of offsets for every 5 years from 18,000 to 23,000 cal yr.
Following the initial analysis using all 54 available 14C ages we repeated the analysis after eliminating all 14C ages with either poor laboratory precisions (+>200 yr) or a poor fit (by >400 yr) with the initial InCal13 calibration line derived from all 54 14C ages. Samples with poor precision values were mostly obtained using the older ß-counting technique or by AMS that had small, marginal sample masses. 14C ages that had a poor fit were mostly younger than the predicted IntCal13 ages of the initial 54 sample calibration curve and were likely samples biased by partial decay and imperfect plant macrofossil preservation. Further iterations of this analysis were performed with all samples >400 yr from the latest calibration curve removed while previous removals that were later within 400 yr of the calibration curve were added back into the data set. This procedure was repeated until no more removals or re-inclusions were necessary. This required three separate runs of the analysis after the initial run using all 54 radiocarbon ages, the final version of which is reported in the figures below.
Calibration Results
The results of the calibration best-fit analysis are shown on the plot below with a plot of M values vs. potential offset values. The lowest M value using all 54 radiocarbon ages was 57.33 with an offset of 20675 (gray plot). Using the criteria above only 32 of the original 54 radiocarbon ages were used for calculating the final calibration and yielded a much lower M value of 3.62 and an offset of 20820 (black line).
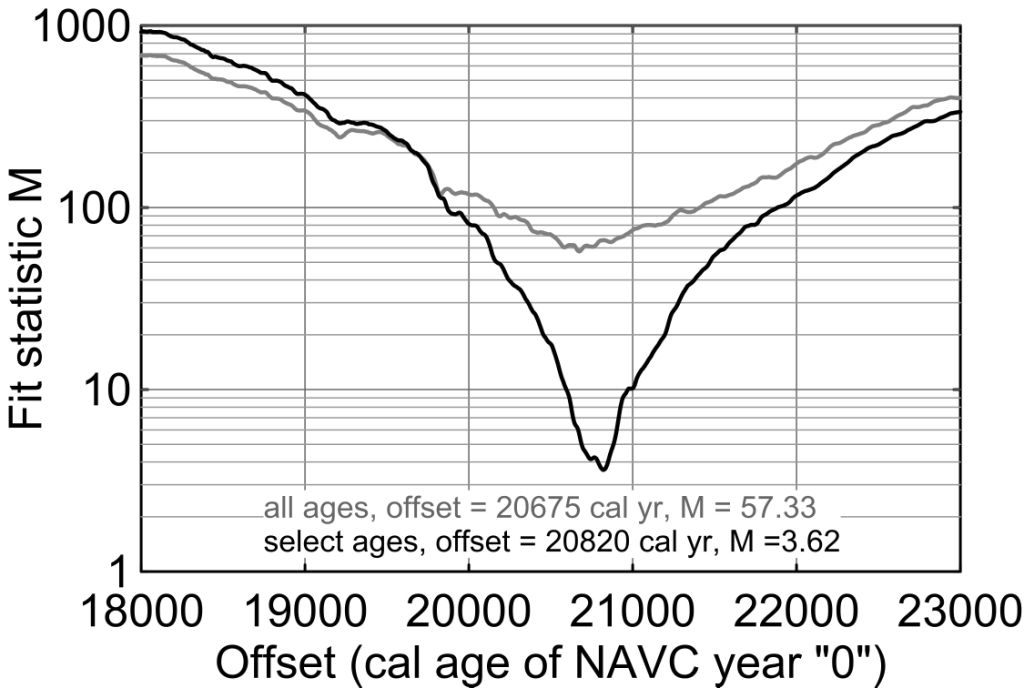
: Plots of the goodness-of-fit statistic (M) over a range (18,000-23,000 cal yr) of offsets (calibrated yr of the NAVC �0� varve yr) using all of the radiocarbon ages (gray plot) and also using just the 32 selected radiocarbon ages (black plot, see text for selection criteria).
The best-fit offset value (NAVC yr �0�) of 20,820 cal yr is shown below on the NAVC calibration plot as the best fit of the NAVC and IntCal13 data sets. In equation form the calibration of the NAVC (AM years) is:
or to translate NAVC (AM years) to years before 2000 AD (2bk), which adds 50 yr to the calibrated age:
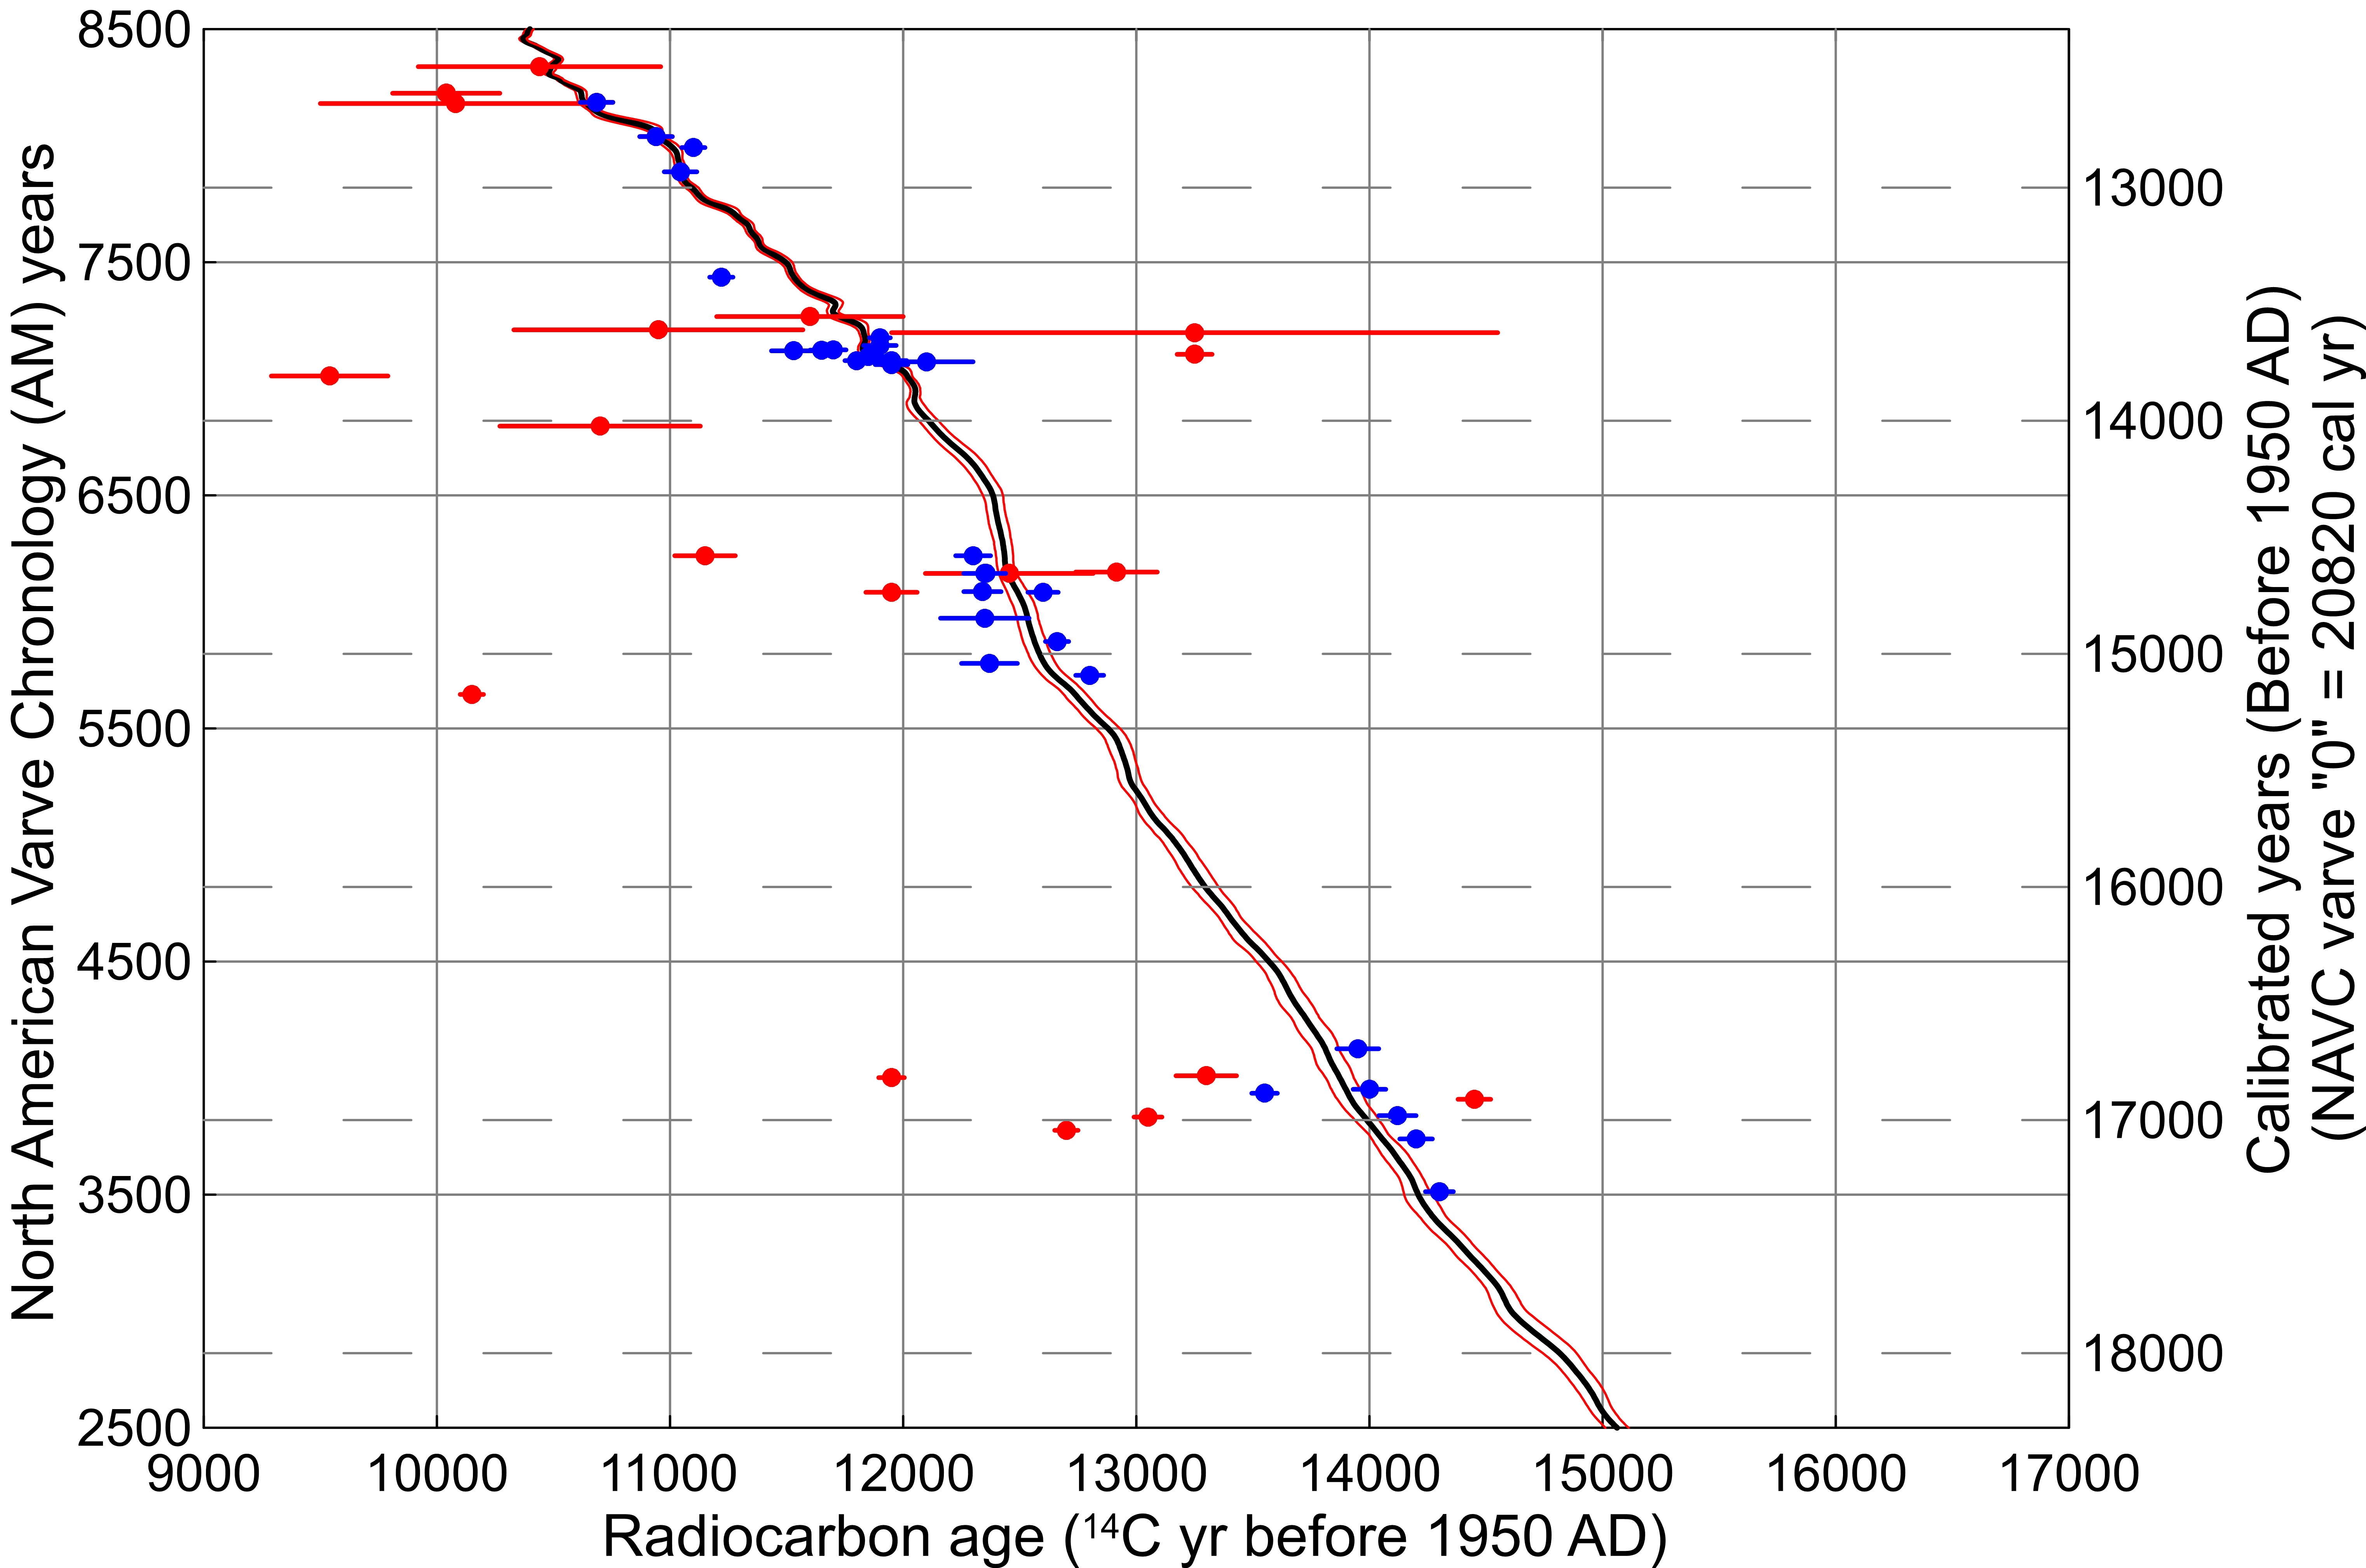
: Plot of all radiocarbon ages with their 1-sigma lab uncertainties along with the best fit of the IntCal13 data set (black line) and 1-sigma uncertainty interval (red lines) having an offset or AM �0� varve yr value = 20,820 cal yr. Radiocarbon ages shown in blue are those used for the analysis as explained above.
Tables are available below for download that have an interpolation of the IntCal13 data set (cal yr) to NAVC years for every ten years of the NAVC numbering system from AM 2500-8500.
- Excel version of calibration table: Calibration Excel table
- Text file version of calibration table: Calibration text file table
Given the spread of 14C ages adjacent to the calibration line it seems likely that true calibration ages could be as much as a century or more older than the statistical calibration curve shown here for just the selected ages isolated by iterative analysis if one were to reason that the oldest 14C ages along the calibration curve were the most accurate.
The IntCal13 NAVC Calibration vs. the IntCal09 Calibration
The IntCal13 calibration shown here updates the last published calibration of the NAVC that used IntCal09 (Ridge et al., 2012). The updated calibration is 50 years older. Revision of the calibration of the NAVC will occur in the future as new radiocarbon ages are obtained and improvements occur to the IntCal calibration data set.
Analysis of Calibration Uncertainty
An initial assumption of the analysis above is that there is no uncertainty in NAVC radiocarbon ages other than what is reported as analytical uncertainty by radiocarbon labs. This is generally not true and difficult to assume since there are always geological sources of uncertainty. The goodness-of-fit value using all 54 radiocarbon ages (57.3) is higher than expected if analytical error is the only source of uncertainty and the scatter in the data is greater than the reported lab uncertainties for most of the radiocarbon ages. This indicates that geologic processes are creating some of the scatter in the data. Unfortunately, there is no way to make unbiased predictions about geologic uncertainties although their magnitudes would appear to be somewhat limited as suggested by the data distribution.
There are two major geologic uncertainties that cannot be ignored when using radiocarbon ages to define the NAVC calibration. Radiocarbon ages are from fossils in outcrop or core samples and in both cases organic materials are always in some stage of decay. This opens up the possibility of contamination by younger or older materials with contamination by younger materials more likely during sample decay. Ages that are randomly scattered to the left of the calibration line on the plot above may reflect contamination by younger materials, especially when sample sizes are small and the sample has experienced decay since the time of deposition. Samples of this type will give a calibration younger than the true calibration and tend to skew the analysis in that direction. It is suspected that this has happened with some samples many centuries younger than the calibration line. The iterative removal of all samples outside of 400 years from the calibration line was an attempt to reduce the influence of such outliers.
A second uncertainty due to geologic processes can be seen with samples to the right of the calibration line. There are several ages that occur 100 or more years to the right of the best-fit line. A cluster of samples 100-200 years to the right of the line appear to define a limit. Some of these fossils may be older than the varves in which they occur because of a lag in deposition due to residence on land or reworking, making them older than the varve in which they occur. This is a more severe problem if fossils are taken from varves that significantly postdate the age of deglaciation. However, most of the fossils are fragile leaves that would not easily survive exposure to weather conditions or renewed transport. More likely most of the ages to the right of the calibration line represent the upper limit of ages that have not experienced significant contamination that could reduce their age and they are likely the closest ages to the true calibration. In this case samples that have experienced contamination by younger materials may have skewed the calibration to a younger position than the true calibration. On the lower part of the plot and also in the range of NAVC years 5500-6500 there are strings of points that seem to parallel the calibration line suggesting that the calibration has been skewed. If this is true an accurate calibration may be as much as 100-200 years older than the best-fit offset of the IntCal13 data set calculated above.
There is no significant error in the NAVC data set as a result of the placement of samples in the varve chronology. All radiocarbon samples collected on outcrops were collected along with small varve cores that were then marked with the fossil positions so they could be matched to the NAVC down to within a part of a particular year. Samples from long subsurface cores were also extracted from cores matched to the NAVC and their positions are also known to within part of a year in the NAVC. An error in varve counting is also not considered to be a valid reason for the apparent older ages to the right of the calibration line. Over-counting of varves by approximately 100-200 years would have to occur in varves AM 6300-7200. This is unlikely given the unambiguous annual layers seen in this part of the varve chronology and the matching of many sections within the Connecticut Valley and between sections in the Connecticut and Winooski valleys from this time. Varves AM 7200-8358 at Newbury, and thus the placement of radiocarbon samples in this sequence, have an acknowledged cumulative uncertainty at AM 8358 of +35/-20 which is still not enough by itself to account for the scatter in the data.
REFERENCES
- For a complete listing of radiocarbon ages from varves in the Connecticut Valley (NAVC) go to Data & Downloads > Radiocarbon Ages.
- Reimer, P.J., Baillie, M.G.L., Bard, E., Bayliss, A., Beck, J.W., Blackwell, P.G., Ramsey, C.B., Buck, C.E., Burr, G.S., Edwards, R.L., Friedrich, M., Grootes, P.M., Guilderson, T.P., Hajdas, I., Heaton, T.J., Hogg, A.G., Hughen, K.A., Kaiser, K.F., Kromer, B., McCormac, F.G., Manning, S.W., Reimer, R.W., Richards, D.A., Southon, J.R., Talamo, S., Turney, C.S.M., van der Plicht, J., and Weyhenmeyer, C.E., 2009, IntCal09 Northern Hemisphere atmospheric radiocarbon calibration curve: Radiocarbon, v. 51, p. 1111-1150. The IntCal09 data set available at: http://calib.qub.ac.uk/calib/
- Reimer, P.J., Bard, E., Bayliss, A., Beck, J.W., Blackwell, P.G., Bronk Ramsey, C., Buck, C.E., Cheng, H., Edwards, R.L., Friedrich, M., Grootes, P.M., Guilderson, P.T., Haflidason, H., Hajdas, I., Hatt�, C., Heaton, T.J., Hoffmann, D.L., Hogg, A.G., Hughen, K.A., Kaiser, K.F., Kromer, B., Manning, S.W., Niu, M., Reimer, R.W., Richards, D.A., Scott, E.M., Southon, J.R., Staff, R.A., Turney, C.S.M., and van der Plicht, J., 2013. IntCal13 and Marine13 radiocarbon age calibration curves 0�50,000 years cal BP. Radiocarbon, v. 55, 1869�1887.
- Ridge, J.C., 2003, Chapter 3: The last deglaciation of the northeastern United States: a combined varve, paleomagnetic, and calibrated 14C chronology, in Cremeens, D.L. and Hart, J.P., eds., Geoarchaeology of Landscapes in the Glaciated Northeast: New York State Museum Bulletin 497, p. 15-45.
- Ridge, J.C., 2004, The Quaternary glaciation of western New England with correlations to surrounding areas, in Ehlers, J. & Gibbard, P.L. (eds.), Quaternary Glaciations � Extent and Chronology, Part II: North America. Developments in Quaternary Science, vol. 2B, Amsterdam, Elsevier, p. 163-193.
- Ridge, J.C., Balco, G., Bayless, R.L., Beck, C.C., Carter, L.B., Dean, J.L., Voytek, E.B., and Wei, J.H., 2012. The new North American Varve Chronology: A precise record of southeastern Laurentide Ice Sheet deglaciation and climate, 18.2-12.5 kyr BP, and correlations with Greenland ice core records. American Journal of Science, v. 312, 685�722.
- Stuiver, M., and Reimer, P.J., 1993. Extended 14C data base and revised CALIB 3.0 14C age calibration program. Radiocarbon, v. 35, p. 215-230.
- Stuiver, M., Reimer, P. J., and Reimer, R. W. 2005. CALIB 6.0. [WWW program and documentation]. Updated version at: http://calib.qub.ac.uk/calib/