
Calibration of the New England Varve Chronology
Calibration of the NEVC is based on radiocarbon ages of plant fossils and in one case a snail shell. Prior to 2008 the lower and upper Connecticut varve sequences were calibrated separately. Now, the consolidation of these sequences, and the incorporation of a 10-yr correction to the lower Connecticut varves, allows a single calibration from radiocarbon ages that span about 4400 varve years. To formulate the calibrated time scale, selected radiocarbon ages were converted to calibrated ages using the CALIB 5.01 program and most updated Intcal4.14c calibration data set (Stuiver and Reimer, 1993; Stuiver et al., 1998; updated to CALIB 5.01 by Stuiver et al., 2005, see CALIB at http://calib.qub.ac.uk/). Samples were screened based on how well they agreed with contemporaneous samples, whether they had a sample size that did not require special small sample treatment (NOSAMS lab samples), and the amount of precision uncertainty they had. The snail shell was not rejected because it did not show evidence of a significant reservoir error as compared to ages from plant fossils in nearly contemporaneous varves. The calibrated ages and their 1 and 2-sigma precisions were plotted vs. the NEVC ages of the samples on the graph below. Points with precisions shown in green are from the lower Connecticut varves of the NEVC and points shown with precisions in purple are from the upper Connecticut varves. Points shown in black with gray precisions were not used in the analysis to define the calibration or best-fit lines (lines are explained below). The lower and upper Connecticut NEVC time scales are shown in their overlapping position with lower Connecticut 6300 = upper Connecticut 6632. The lower Connecticut axis has also been broken to eliminate NE varves 5669-5678, now known to be a 10-yr mistake in varve measurement.
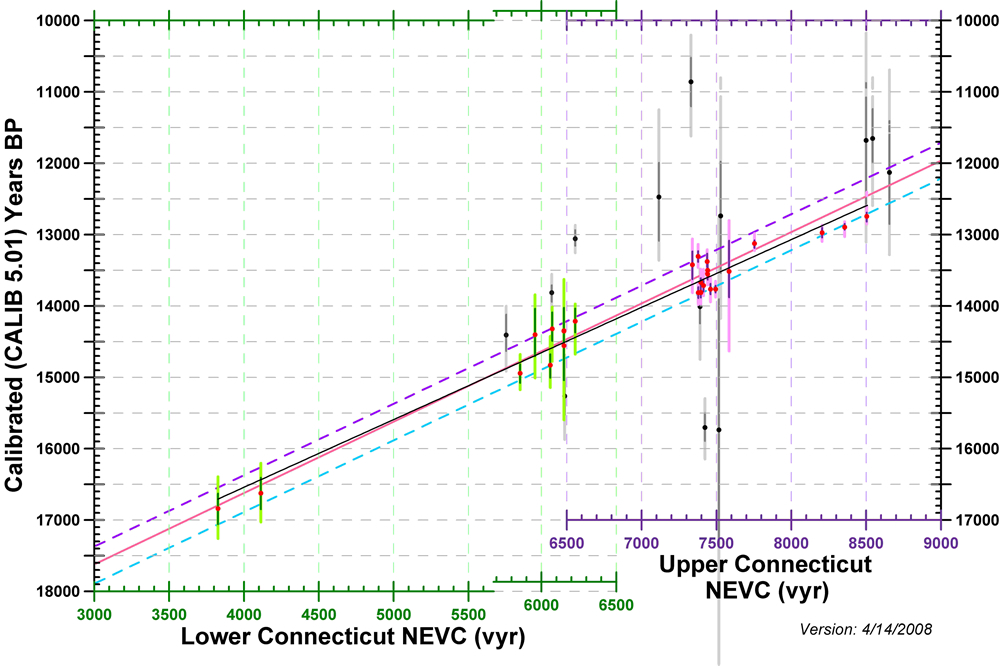
Calibration curve for Lower and Upper Connecticut Valley varve records. Click image to download larger version (~350 KB JPEG).
The calibrated age vs. NEVC plot for selected radiocarbon ages was used to formulate a calibrated age time scale for the NEVC. The thin black line represents a best-fit linear regression of the mean calibrated age probabilities obtained from radiocarbon ages and their precision uncertainties using CALIB 5.01. Ideally one would hope to have all the points define a straight line with a slope of -1.0 (-1 cal yr = 1 varve yr). Note that although the line slopes down from upper right to lower left the slope is still negative because NEVC years get higher as they get younger. Two things interfere with the ideal relationship of a slope = -1.0. There are likely some significant lag times in organic fossil deposition that cause some fossils to be older than the varve in which they occur (see Varve Geology - Dating). In addition, there are small unknown amounts of contamination as well as precision uncertainties that occur in all radiocarbon samples. Hopefully, most of the significant problems with these uncertainties have been eliminated through careful sample selection. Unfortunately, all plant fossil samples are in some stage of decay and contamination and precision uncertainties are very difficult to evaluate without comparison to a known age (something that is not possible) and errors may be amplified by small radiocarbon sample sizes. The strategy available for dealing with these problems is to have a large set of ages from large samples within which comparisons can be made. Radiocarbon ages with obvious problems such as extremely large precision uncertainties or that have ages very different from samples in nearly contemporaneous varves have been eliminated from this analysis as explained above. For a complete listing of all radiocarbon ages and the ages that were used for the analysis see radiocarbon data download.
The graph above places several constraints on the calibration of the NEVC. In addition to the best-fit linear regression line (black) there are several other lines (red, blue, purple) with a slope of -1.0 (-1 cal yr/1 varve yr) that are explained below. Unless there are significant errors in the counting of varves, a calibration line must have a slope of -1.0. The best-fit line has a slope close to -1.0 but slightly greater (-0.95). This is primarily because radiocarbon ages on the younger (right) side of the diagram dominate the regression fit (NE yr 7300 and higher) and are from the Newbury, Wells River, and Passumpsic Valley sections where samples are from varves that post-dated deglaciation by a minimum of 400 years. (On the right side of the plot there are many ages from the NE 7300-7500 interval that plot on top of each other.) Many of the ages from varves younger than NE 7300, especially those from twigs, are good candidates for significant lag times (1 century or more). This causes the best-fit line on the right side of the plot (at NE 8500) to be skewed toward ages that are older than varves in which they occur (by up to ~150 yr), producing the slope that is slightly greater than -1.0. New radiocarbon ages from older varves on the left side of the plot would probably improve the slope of the best-fit line by offsetting the influences of the younger samples, thus more closely aligning it with an ideal slope of -1.0.
An error in varve counting is not considered to be a valid reason for the apparent older ages at Newbury. Over-counting of varves by approximately 200-300 years would have to occur in upper Connecticut varves 6600-7500. This is unlikely given the generally unambiguous annual layers seen in this part of the upper Connecticut sequence and the general pattern of varve matching between many sections within the Connecticut Valley and between sections in the Connecticut and Winooski valleys during this time. Varves NE 7500-8679 at Newbury, and thus the placement of radiocarbon samples in this sequence, have an acknowledged cumulative uncertainty at NE 8679 of +35/-20.
The other straight lines on the graph above (red, blue purple) are calibration lines that assume a 1 cal yr = 1 varve year relationship, i.e. a slope of -1.0. The red (center) line is the currently accepted calibration line that attempts to go through the middle of the data, assuming that some of the radiocarbon ages may be too young (younger than the varve in which they occur) because of contamination and/or lab uncertainty and some of the ages are older than the line and believed to be associated with lag times.
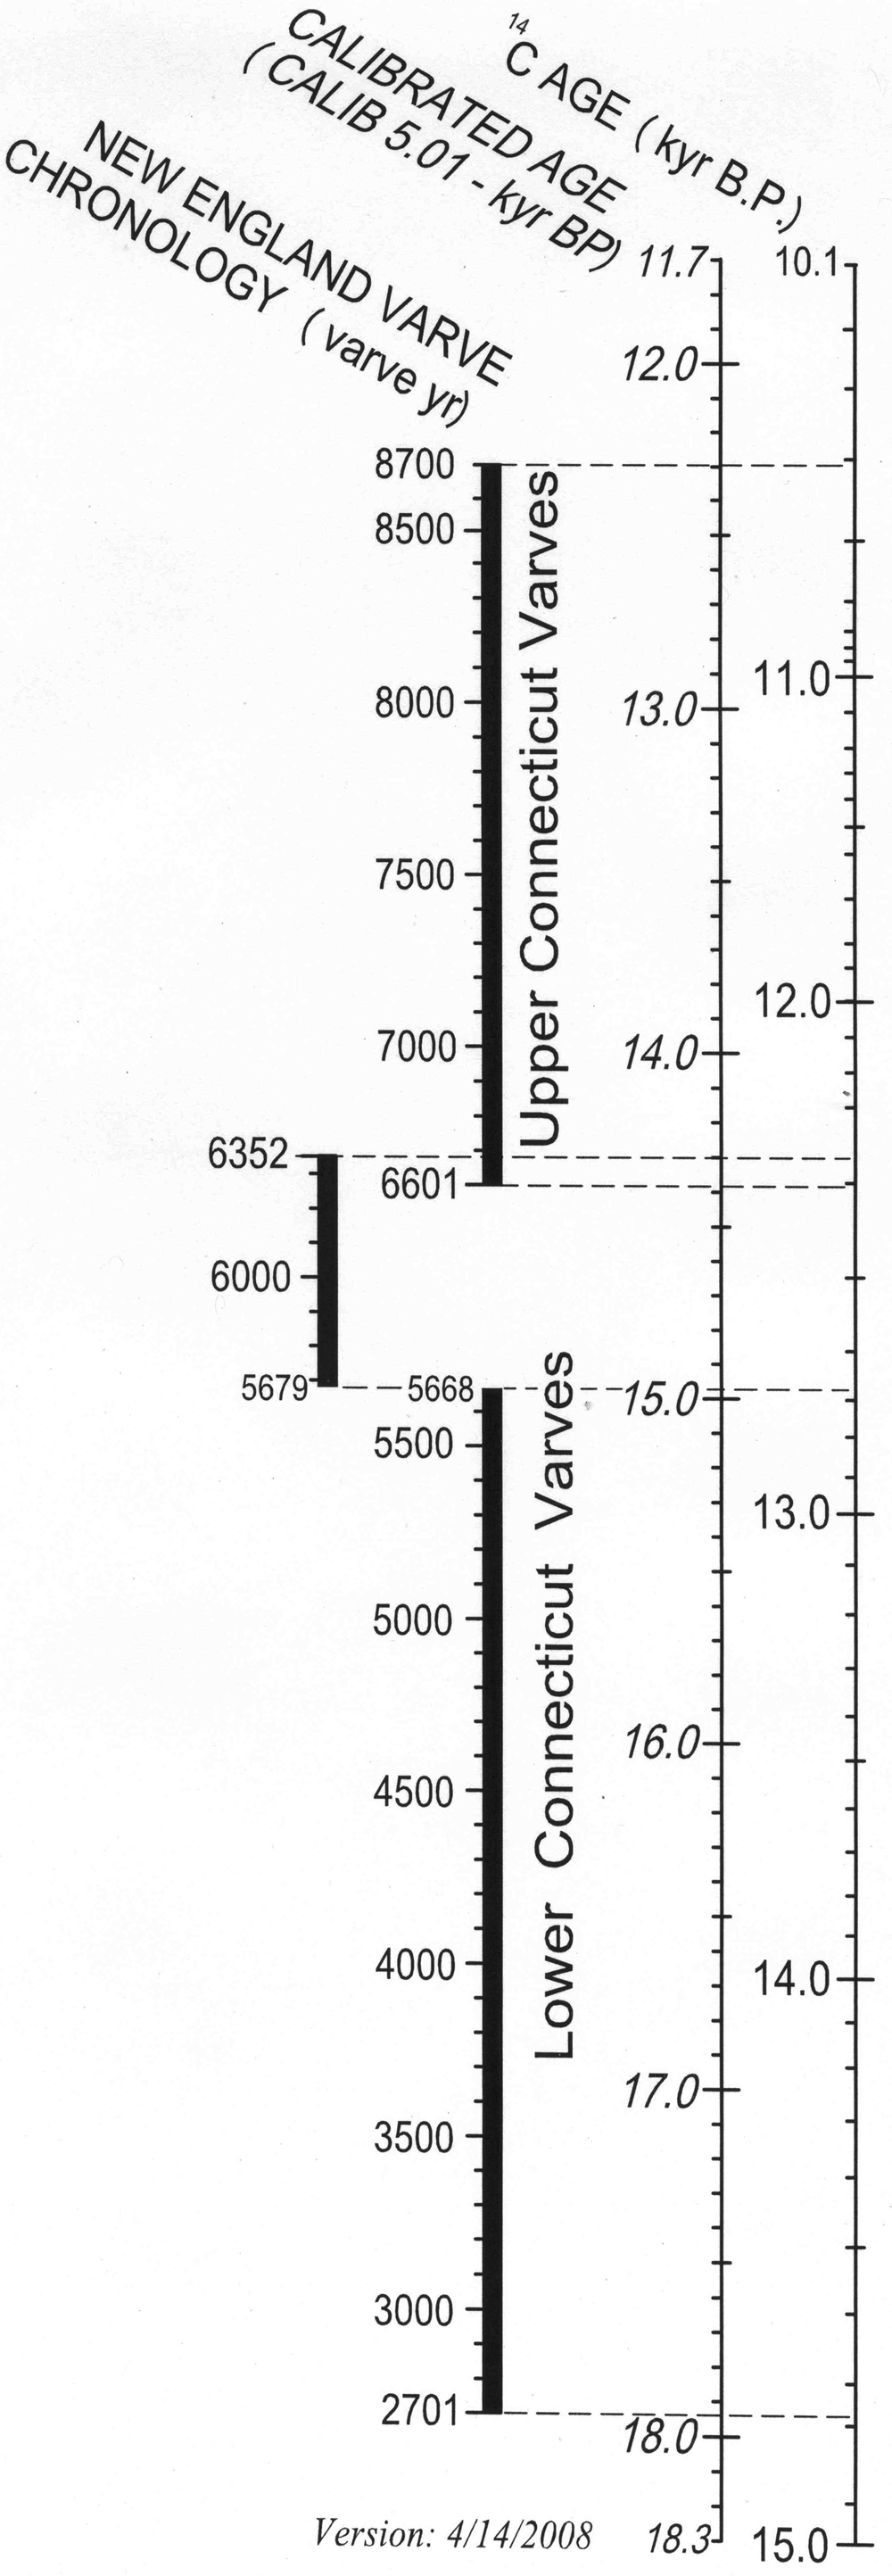
Calibrated time scale for the consolidated NEVC. Click image to download larger version (~700 KB JPEG).
The blue (older) and purple (younger) dashed calibration lines demonstrate some of the restrictions placed on calibration by the data set. The dashed blue line (250 yr older than the red center line) shows what the calibration would look like if the oldest ages relative to associated varve years (from Newbury, Wells River, and Passumpsic Valley) are used to position a calibration line with a slope of -1.0. This line represents the case in which lag times are assumed to be zero and differences from the line (younger side) are assumed to be due to contamination by younger materials or analytical uncertainties. This calibration line is not valid unless the ages younger than the line all have significant errors since they depict calibrated ages that are much younger than the blue line ages of varves in which they occur. For this reason this calibration line (blue) appears to be too old to be valid unless there are many samples with contamination errors approaching about 500 years.
The purple dashed line (250 yr younger than the red center line) shows what the calibration would look like if the youngest ages relative to associated varve years (from Canoe Brook, Aldrich Brook, and Newbury sites) are used to position a calibration line with a slope of -1.0. This calibration line represents the case in which contamination errors associated with younger materials are considered to be zero and age differences from the line (older side) are due to depositional lag times. This calibration line is not valid unless some of the older ages relative to this line have significant errors. Some of the calibrated ages when viewed relative to this line depict times pre-dating deglaciation at the sample sites, i.e. fossils that were alive prior to deglaciation and would have to be transported from down valley sites after deglaciation if they are not ages with errors. Many other samples are from the approximate time of deglaciation and it is unlikely that abundant fossils would be recovered from this time period unless they were somehow transported from down valley. This purple calibration line appears to be too young to be valid unless one accepts the possibility of lags contemporaneous with or pre-dating deglaciation.
The red center line calibration line at this point seems to be the best choice as a calibration given some of the potential uncertainties with radiocarbon ages. If the radiocarbon ages do not have extreme contamination errors and/or extreme lag times associated with them the center line seems like a valid choice for a calibration given the quality of the radiocarbon data set and with an acknowledged + 100-yr uncertainty. Improvement in the exact position of the calibration line would likely improve if more radiocarbon ages were obtained from the lower part of the NEVC.
Using the center line calibration above, a calibrated time scale (cal kyr BP) relationship was established for the consolidated NEVC as shown at right. A radiocarbon time scale was formulated by using the CALIB5.01 program to assign mean probability calibrated ages to radiocarbon times for every century from 10.0-15.0 14C kyr BP. The version shown here is an update of the last published calibration (Ridge 2003, 2004) that showed separate calibrations of the lower and upper Connecticut varve sequences and was based on many fewer radiocarbon ages that were centered on specific areas of each sequence. The calibration shown here depicts a calibration 1-2 centuries older in places than the last published version and is used throughout this web site. Revision of the calibration will occur as new radiocarbon ages are obtained.
References
- For Radiocarbon ages used in calibration go to Radiocarbon Age Download.
- Ridge, J.C., 2003, Chapter 3: The last deglaciation of the northeastern United States: a combined varve, paleomagnetic, and calibrated 14C chronology, in Cremeens, D.L. and Hart, J.P., eds., Geoarchaeology of Landscapes in the Glaciated Northeast: New York State Museum Bulletin 497, p. 15-45.
- Ridge, J.C., 2004, The Quaternary glaciation of western New England with correlations to surrounding areas, in Ehlers, J. & Gibbard, P.L. (eds.), Quaternary Glaciations � Extent and Chronology, Part II: North America. Developments in Quaternary Science, vol. 2B, Amsterdam, Elsevier, p. 163-193.
- Stuiver, M., and Reimer, P.J., 1993. Extended 14C data base and revised CALIB 3.0 14C age calibration program. Radiocarbon, v. 35, p. 215-230.
- Stuiver, M., Reimer, P.J., Bard, E., Beck, J.W., Burr, G.S., Hughen, K.A., Kromer, B., McCormac, F.G., van der Plicht, J., Spark, M., 1998. INTCAL98 radiocarbon age calibration 24,000 � 0 cal BP. Radiocarbon, v. 40, p. 1041-1083.
- Stuiver, M., Reimer, P. J., and Reimer, R. W. 2005. CALIB 5.0. [WWW program and documentation]. http://calib.qub.ac.uk/calib/