
The NAVC and Deglaciation of the Northeastern U.S.
In the northeastern U.S., varve records that include basal and ice-proximal varves have been matched to the NAVC. This allows the formulation of the history and rates of deglaciation. For how a deglaciation record is formulated see Glacial Varve Geology-Glacial Varves and Deglaciation. Such a reconstruction of deglaciation was first performed by Antevs (1922) who also tabulated rates of deglaciation for the Connecticut and Merrimack valleys. The map below was compiled by J.W. Goldthwait (in Antevs, 1922) and in addition to showing positions of ice recession in varve years, as formulated by Antevs, has a compilation of all end moraines, ice flow directions, and erratic trains known at the time. For a more detailed discussion of the history of Antevs' work on varves and deglaciation click here.
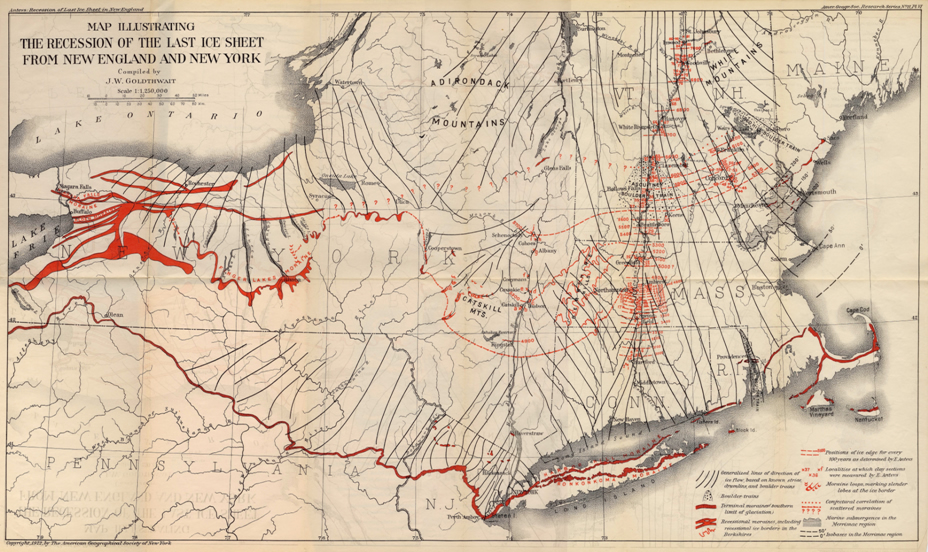
Compiled by J.W. Goldthwait, Plate VI of Antevs (1922). Click image for high resolution version (~530KB JPEG).
Connecticut Valley Deglaciation
Since Antevs' time a refinement of the history of deglaciation has occurred in the Connecticut Valley from northern Connecticut to northern New Hampshire and Vermont as new basal and ice-proximal varve localities have been found and glacial readvances have been documented in several places. The general trend we see today is for an overall acceleration of ice recession during four separate periods of deglaciation punctuated by brief periods of readvance, end moraine building, or very slow ice recession. A highly detailed version of this time distance plot, showing all varve sections, is given at NAVC Today.
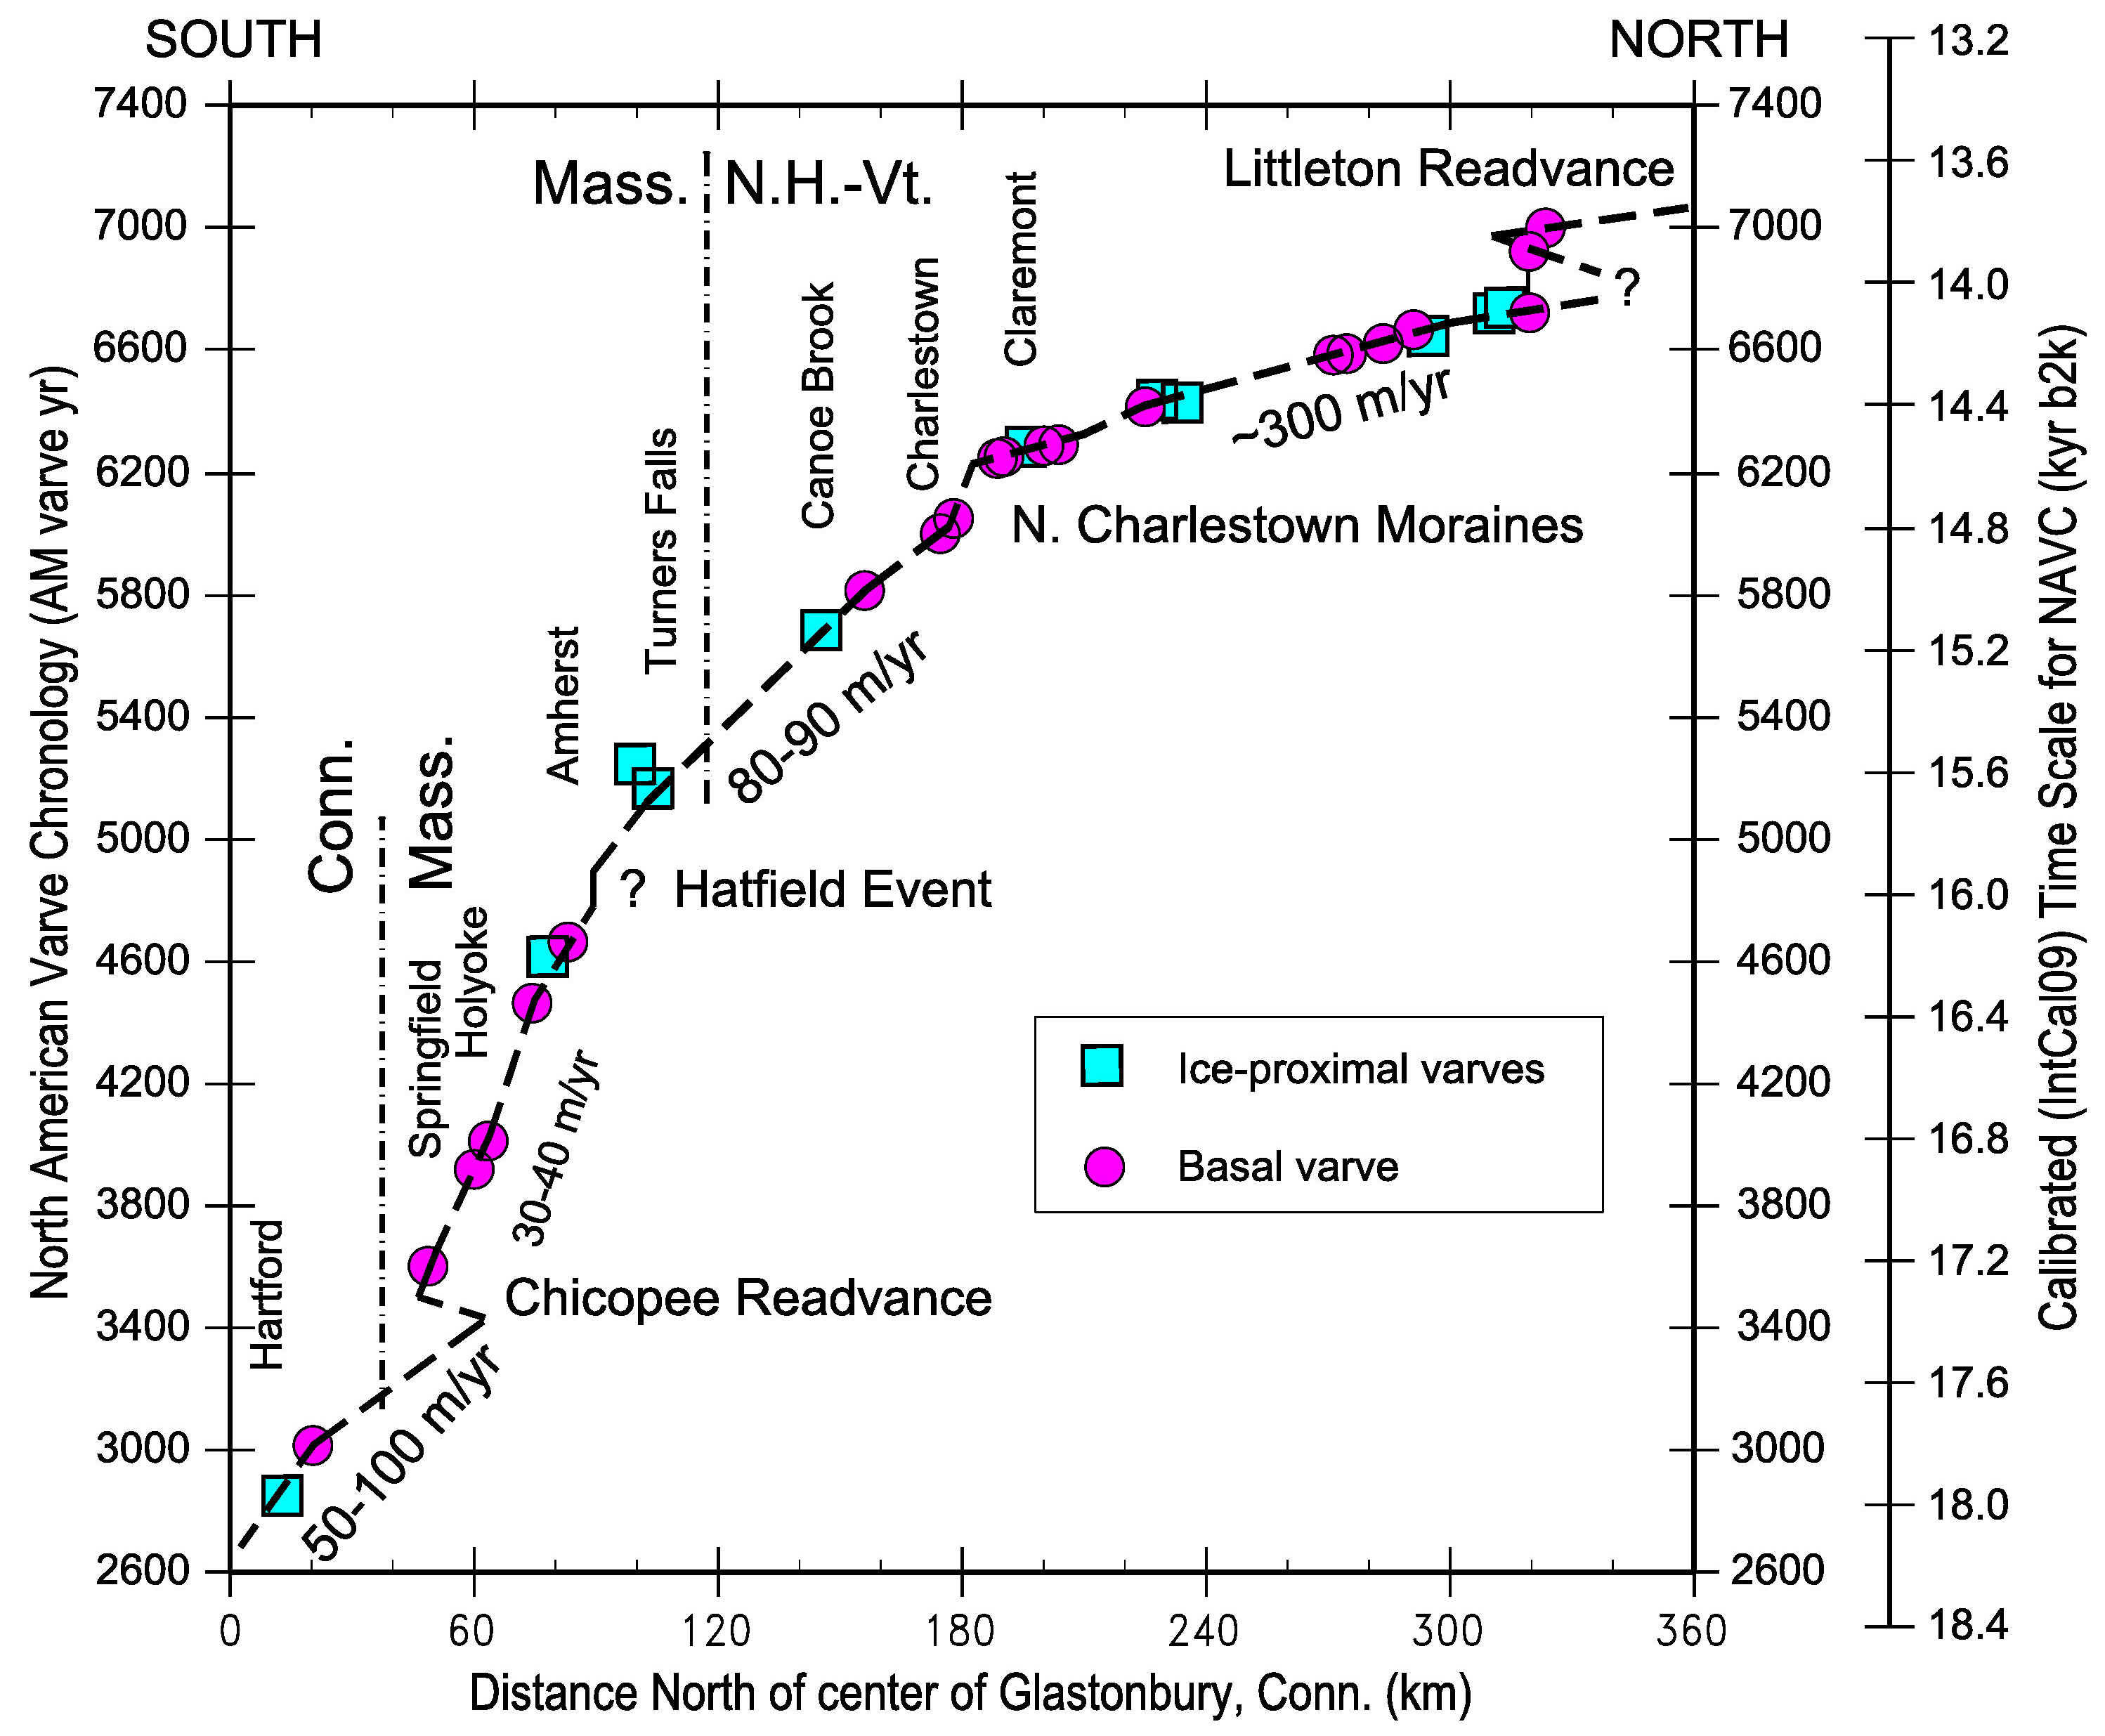
Time distance plot of deglaciation of the Connecticut Valley. The age scale on the right side of this diagram is in thousands of years before 2000 AD (b2k). The horizontal axis shows the distance north of Glastonbury, Connecticut in the direction of ice recession. See text for further description. Click on image for a high resolution version (~2.5MB JPEG).
Merrimack Valley Deglaciation
A similar analysis exists in the Merrimack Valley of southern New Hampshire although it represents only a few centuries of deglaciation. No new ice-proximal or basal varve sites have been found since the time of Antevs as shown on the profile with the time spans of all known varve records. Antevs' varve records are in blue while new sites are in red. The rate of deglaciation in the Merrimack Valley (~100 m/vyr) matches very closely the rate at the corresponding time of deglaciation in the Connecticut Valley (southern New Hampshire and Vermont) shown above.
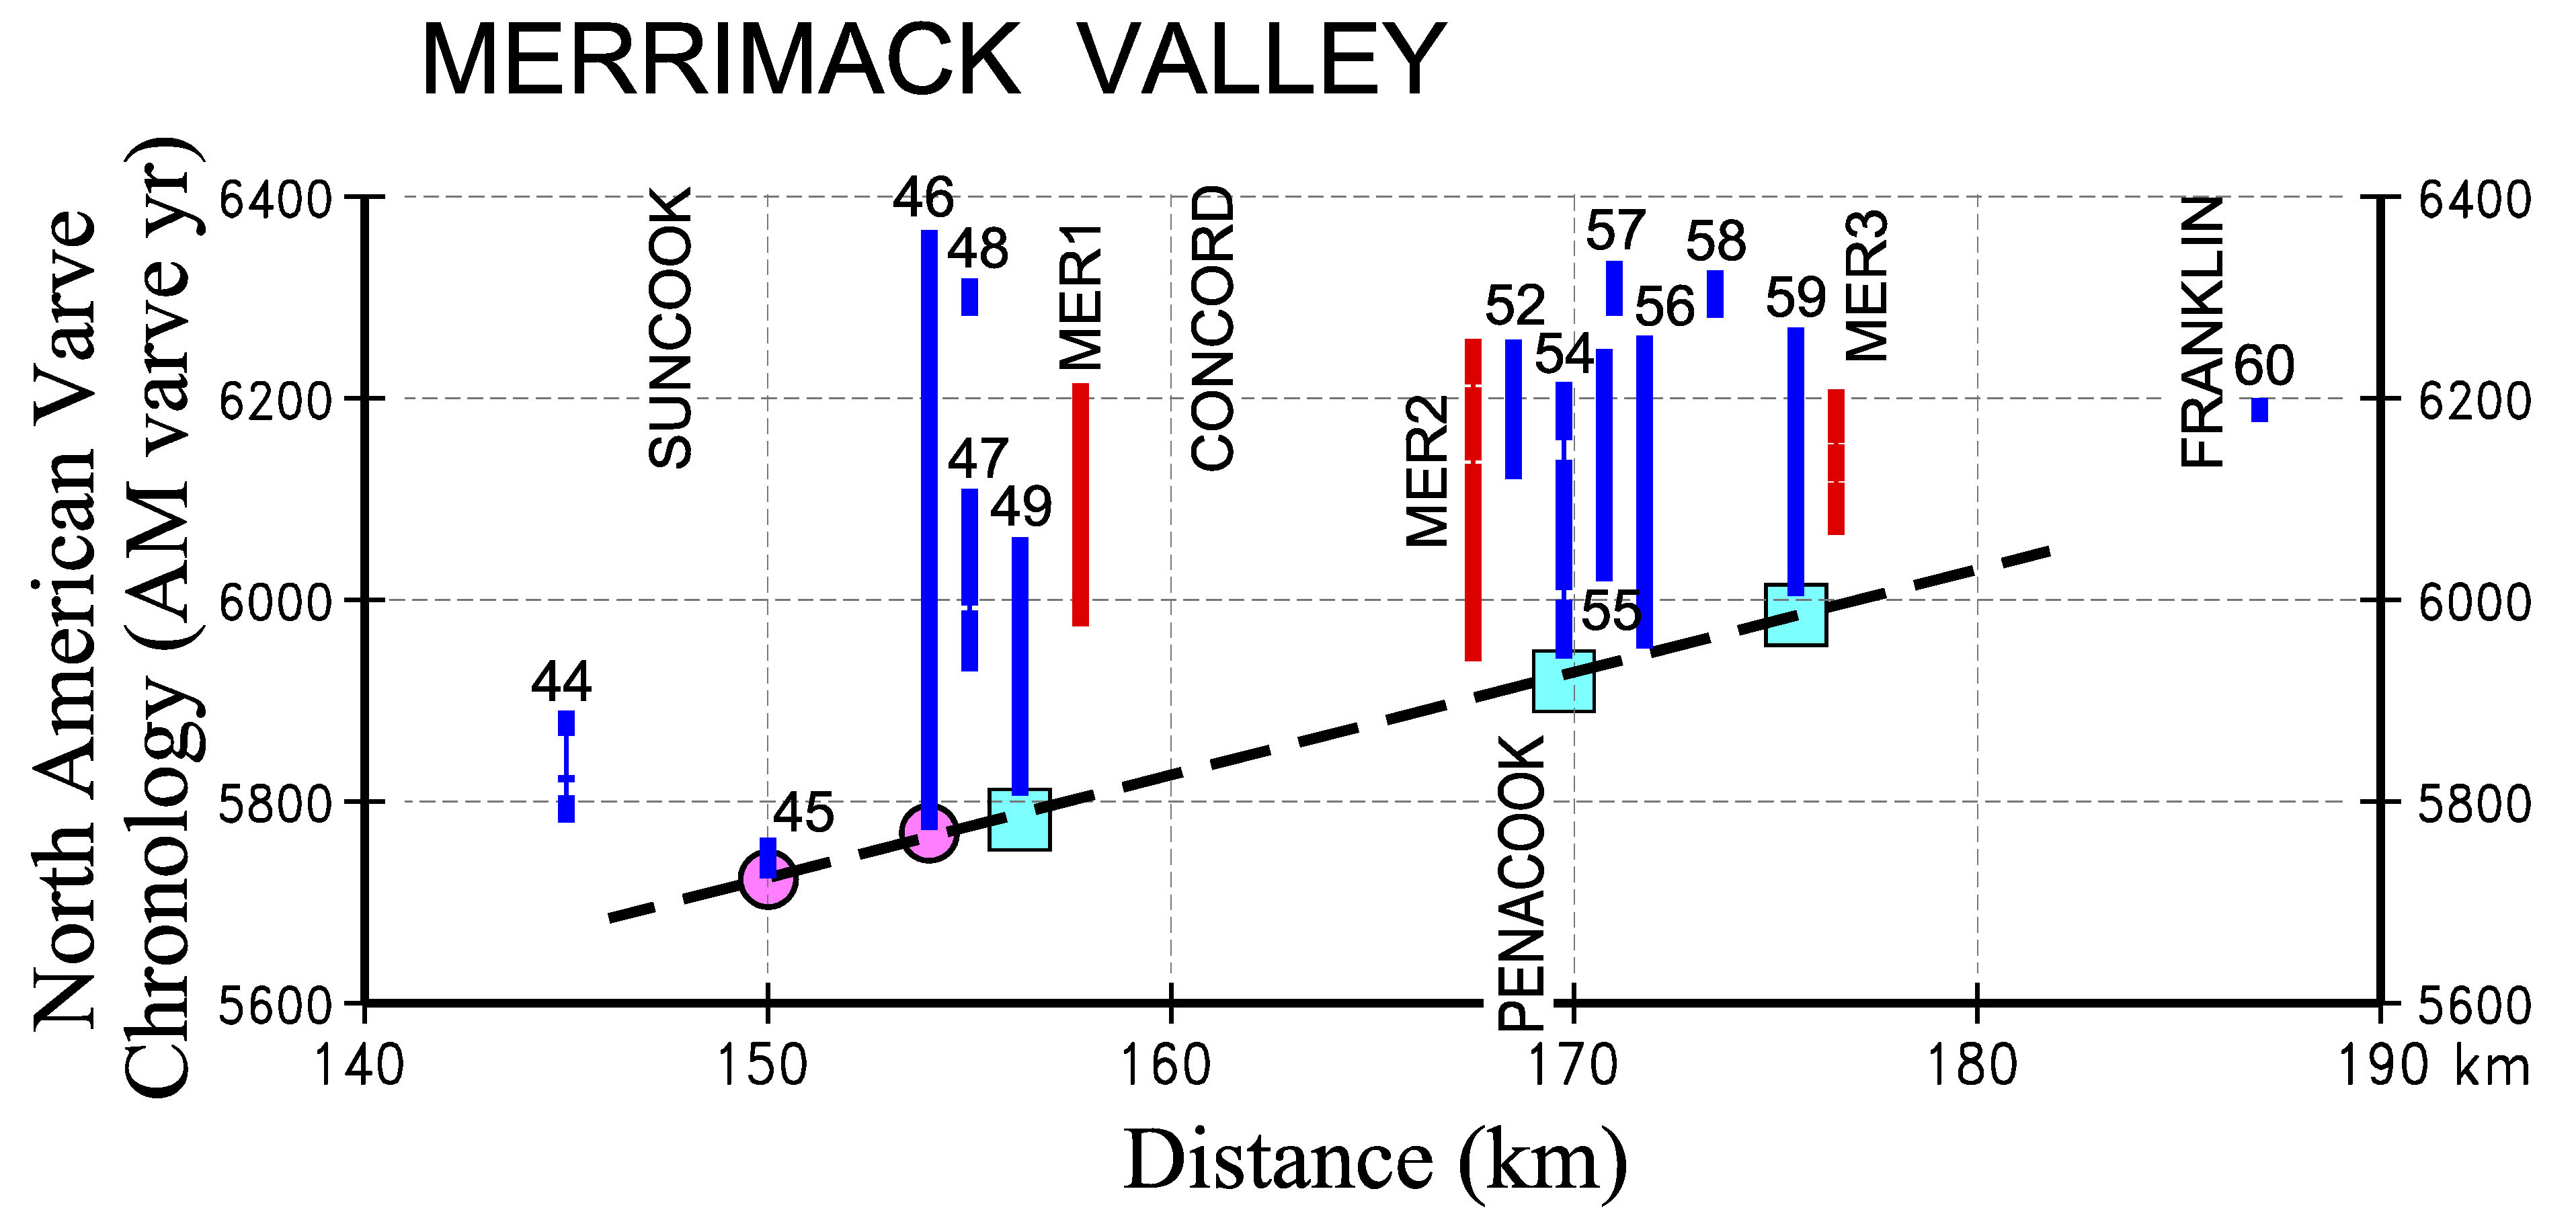
Deglaciation of the Merrimack Valley. See text for description. Click on image for high resolution version (~1MB JPEG).
Deglaciation in the Northeastern U.S.
With the addition of paleomagnetic correlations (See NAVC Paleomagnetism) between western New England, the western Mohawk Valley of central New York, and the Champlain Valley, as well as the current calibration of the NAVC (See NAVC calibration), it has been possible to reconstruct a more comprehensive deglaciation history for the northeastern U.S (see Ridge, 2003, 2004 for initial reconstructions that are updated here to the NAVC calibration and new core data in the Connecticut Valley). Deglaciation on the maps below has been plotted in terms of radiocarbon and calibrated years based on the new radiocarbon calibration of the NAVC. In western New England deglaciation is directly tied to the varve chronology from central Connecticut northward. Ice recession lines in eastern Massachusetts, southern Connecticut, and Rhode Island have limiting ages placed on them from varve analysis and age estimates based on inferred correlations of end moraines, inferred to represent ice recession pauses or readvances, and ages of features in ice core records (Boothroyd et al., 1998; Stone et al., 1998).
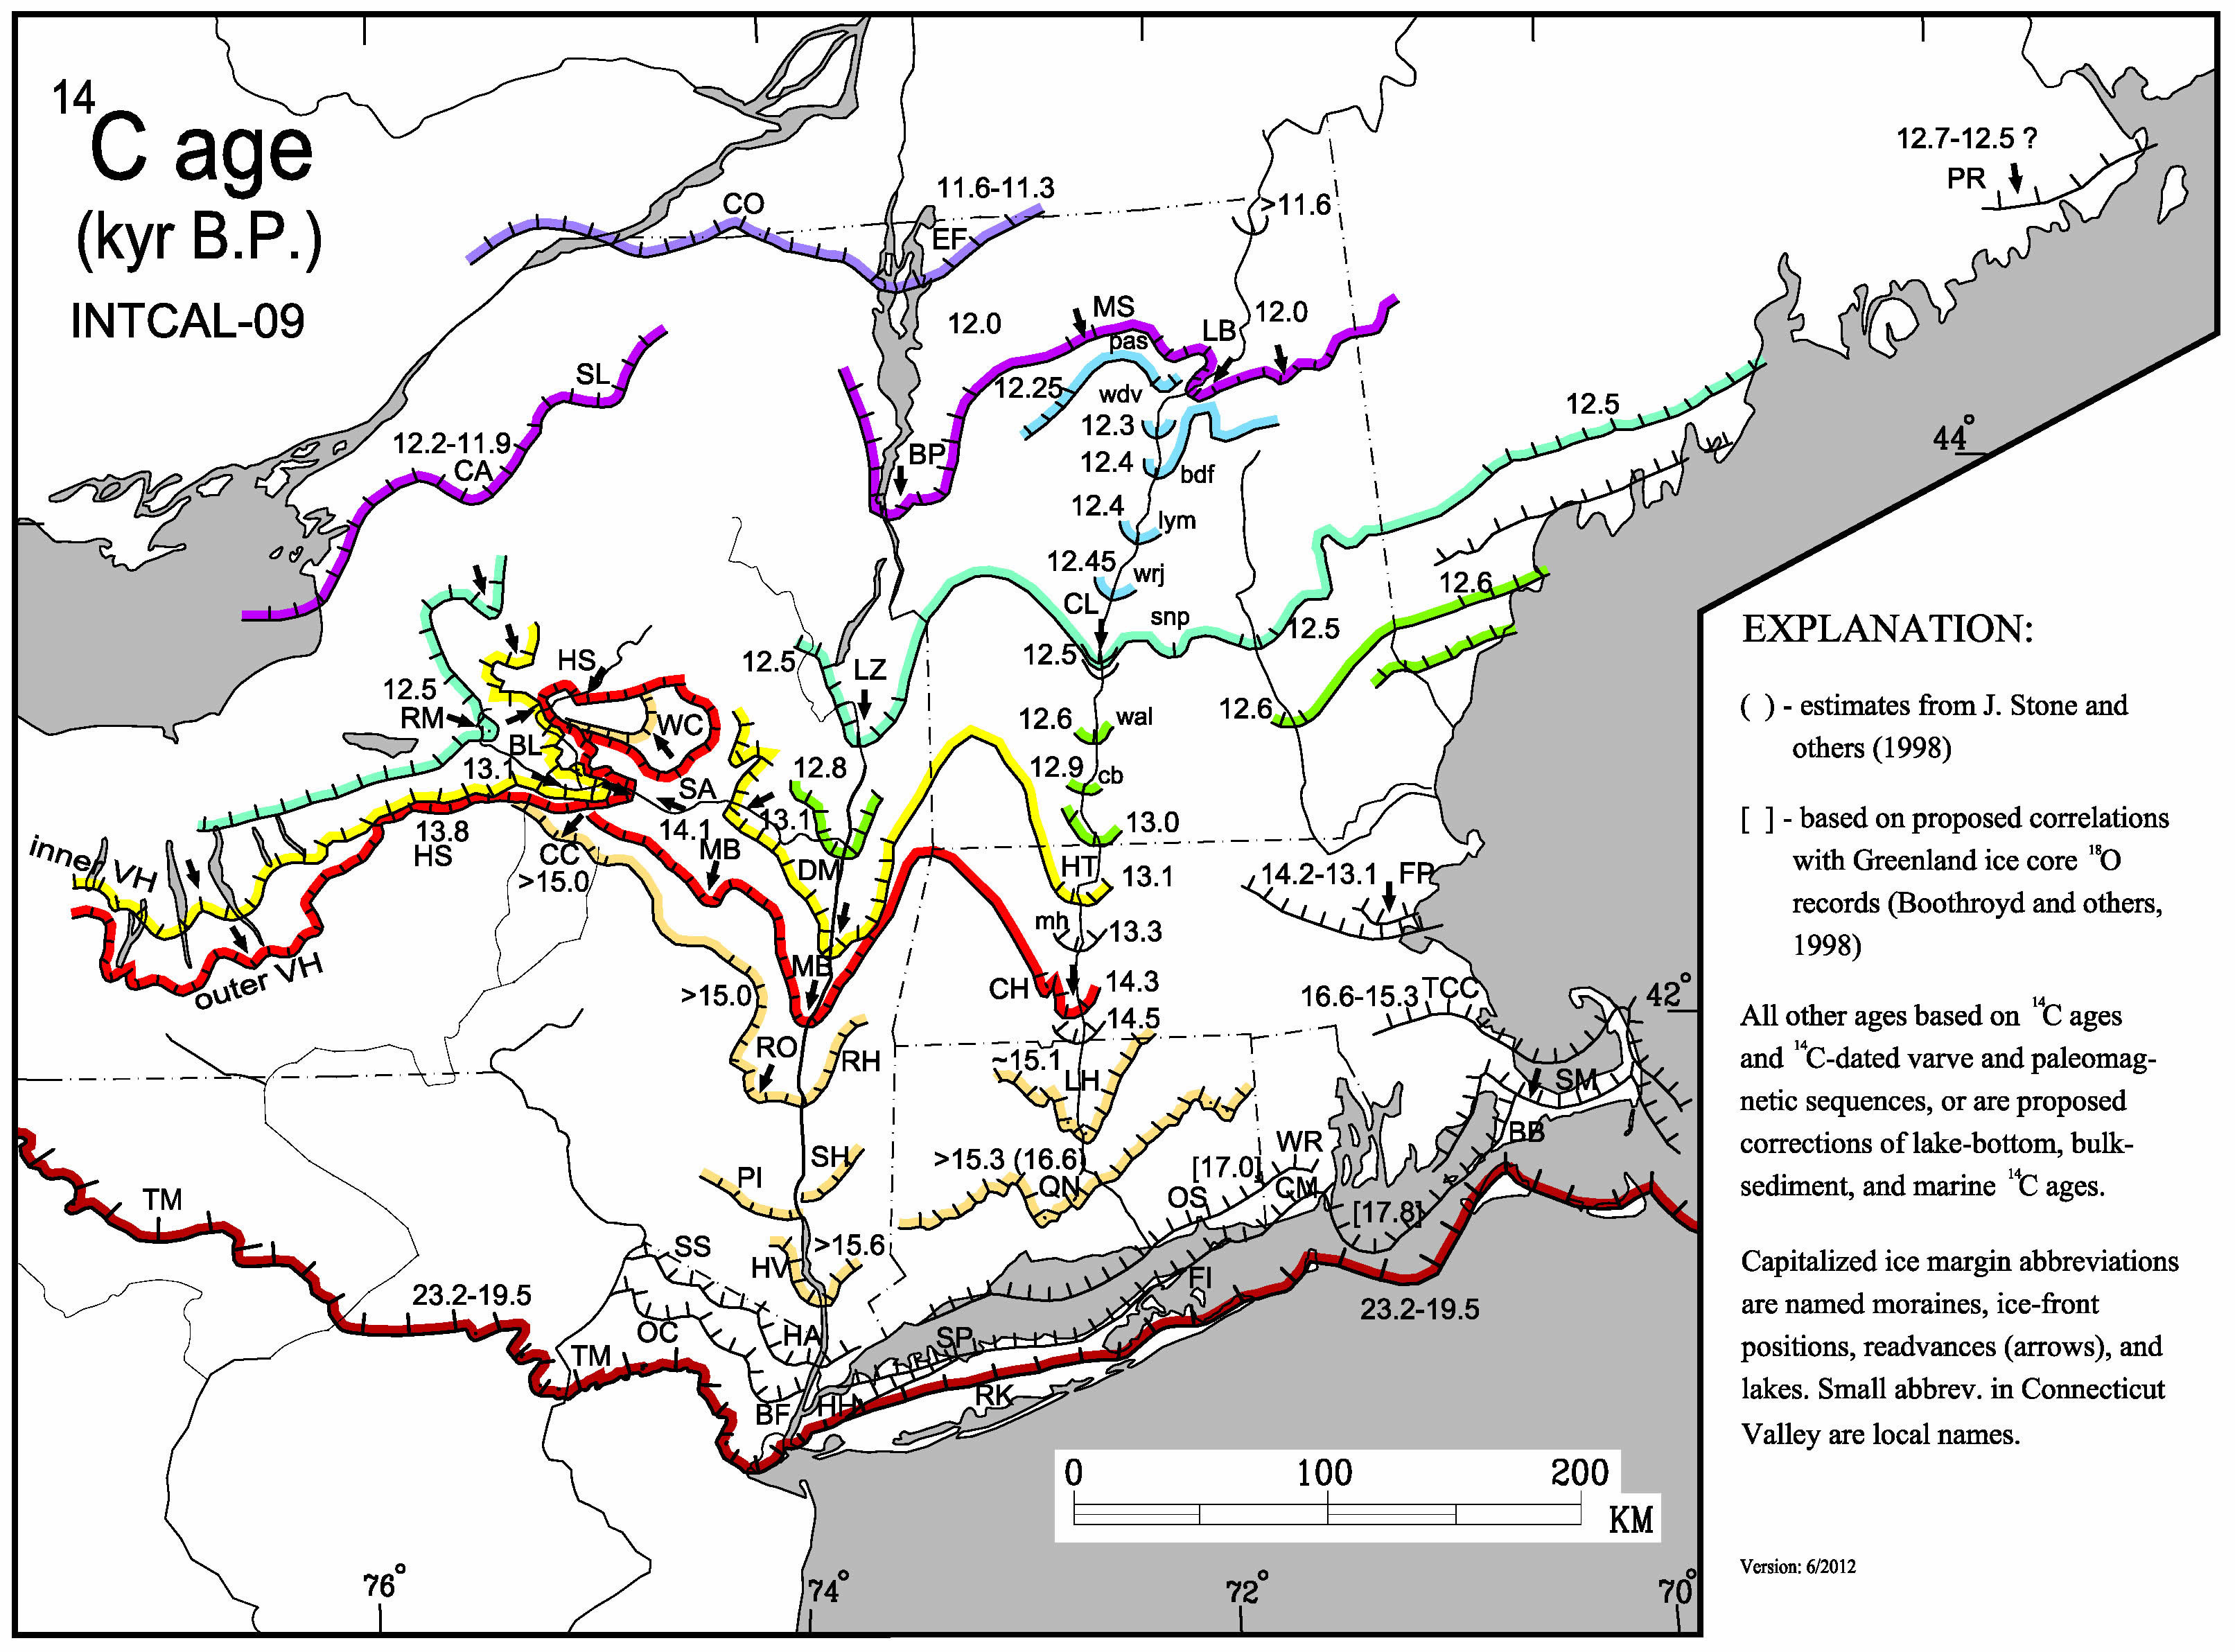
Radiocarbon ages of ice margins during ice recession in the northeastern U.S. The radiocarbon ages are tabulated on the map in thousands of years before 1950 AD (14C kyr BP). Click on image for high resolution version.
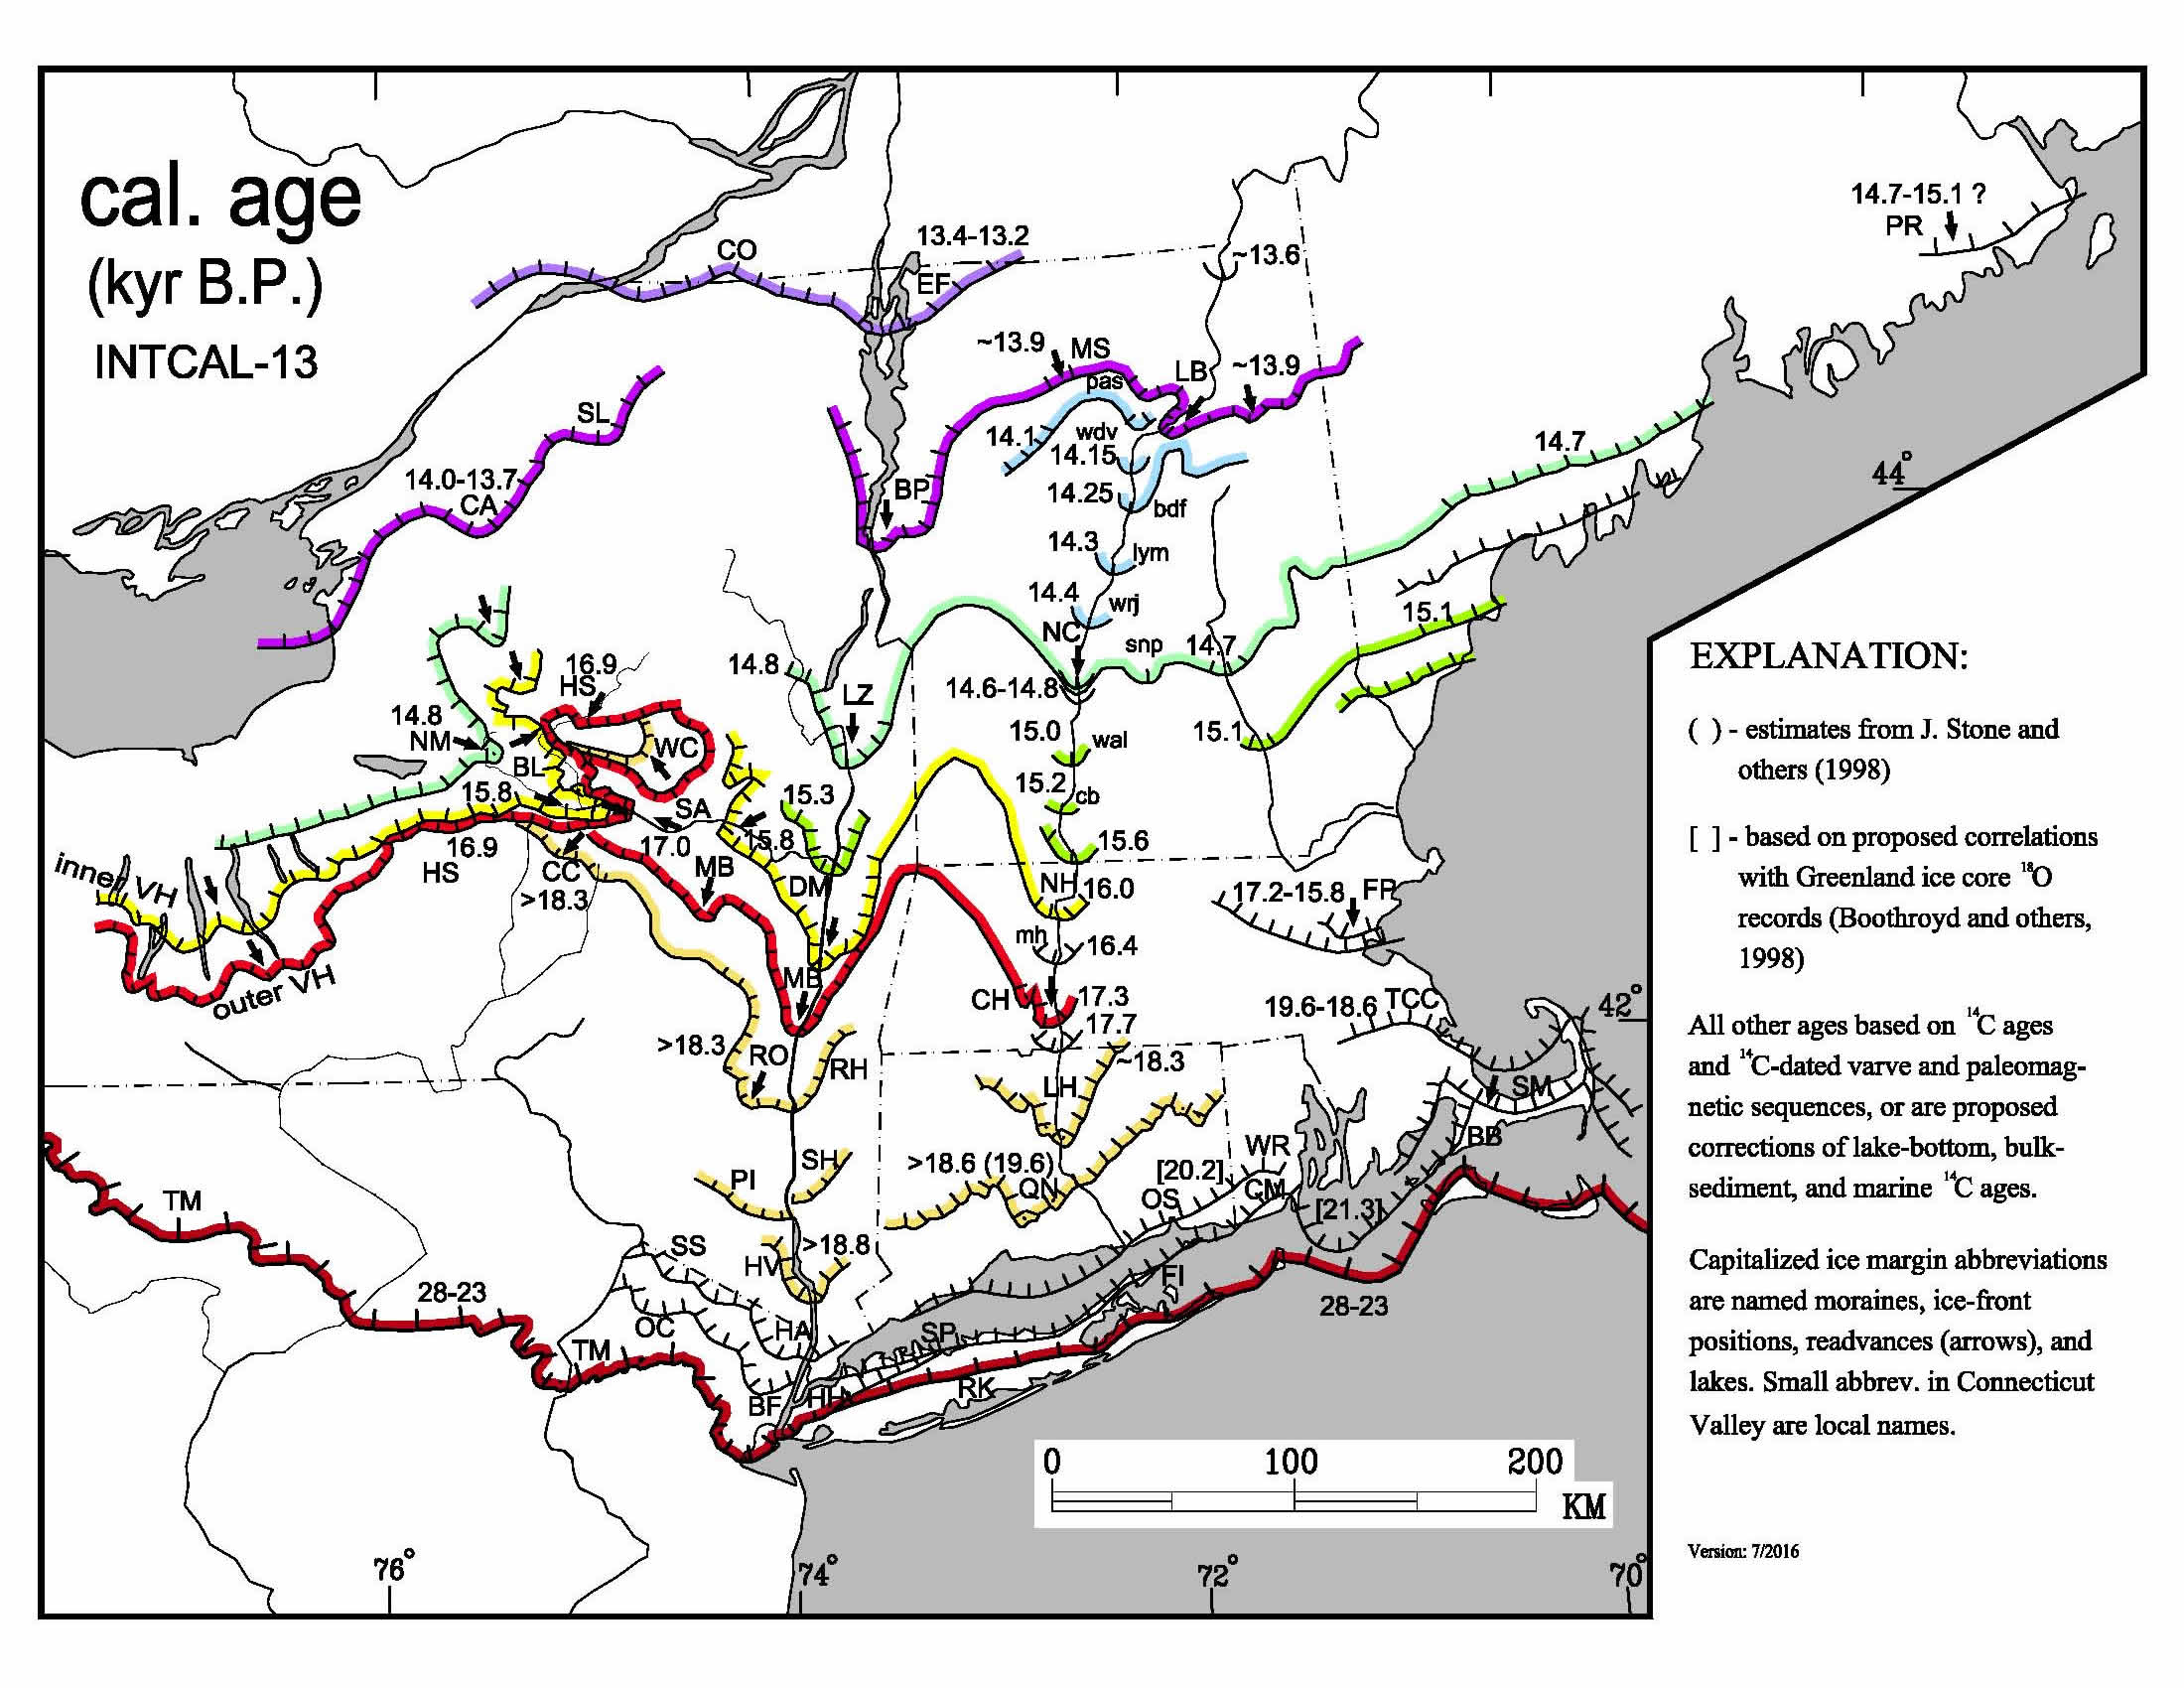
Calibrated ages of ice margins during ice recession in the northeastern U.S. The calibrated ages on the map are tabulated in thousands of years before 1950 AD (cal kyr BP). Click on image for high resolution version.
References
- Boothroyd, J., Freedman, J.H., Brenner, H.B., Stone, J.R., 1998, The glacial geology of southern Rhode Island. In: Murray, D.P. (ed.), Guidebook to Field Trips in Rhode Island and Adjacent Regions of Connecticut and Massachusetts. 90th New England Intercollegiate Geological Conference, Kingston, Rhode Island, p. C5: 1-25.
- Ridge, J.C., 2003, Chapter 3: The last deglaciation of the northeastern United States: a combined varve, paleomagnetic, and calibrated 14C chronology, in Cremeens, D.L. and Hart, J.P., eds., Geoarchaeology of Landscapes in the Glaciated Northeast: New York State Museum Bulletin 497, p. 15-45.
- Ridge, J.C., 2004, The Quaternary glaciation of western New England with correlations to surrounding areas, in Ehlers, J. & Gibbard, P.L. (eds.), Quaternary Glaciations � Extent and Chronology, Part II: North America. Developments in Quaternary Science, vol. 2B, Amsterdam, Elsevier, p. 163-193.
- Stone, J.R., Schafer, J.P., London, E.H., Lewis, R.L., DiGiacomo-Cohen, M.L., Thompson, W.B., 1998, Quaternary geologic map of Connecticut and Long Island Sound Basin (scale 1:175,000). United States Geological Survey, Open-file Report 98-371, 1 sheet, 77 p.