
The New England Varve Chronology and Climate
The NEVC has not only served as a useful time scale for assembling glacial and climatic chronologies, but the varves themselves seem to preserve key information about the character of past climate. Two climate related studies have occurred with the NEVC: 1) a comparison of the Upper Connecticut varves at Newbury, VT with ice core records and 2) spectral analysis of the NEVC (mostly the lower Connecticut sequences) for ENSO-like and longer harmonics. For a full explanation of the spectral analysis see Rittenour and others (2000, also review by Kerr, 2000).
The Newbury Section
The varve section at Newbury, VT was first studied by Antevs (1922; loc. 73) and he matched the bottom of the Newbury varve record to records from other sections in his construction of the upper Connecticut varves of the NEVC. A map of the region around and north of Newbury is shown below. The Newbury section represents a rare situation in the Connecticut Valley where most varve sections are either: 1) truncated by stream terraces formed during post-lacustrine valley incision, or 2) located where the lake filled with sediment and became shallow to the point where winter layer preservation was no longer consistent. The Newbury varves are relatively thin due to their location being remote from major stream valleys that are the source of sediment for much of the varve section.
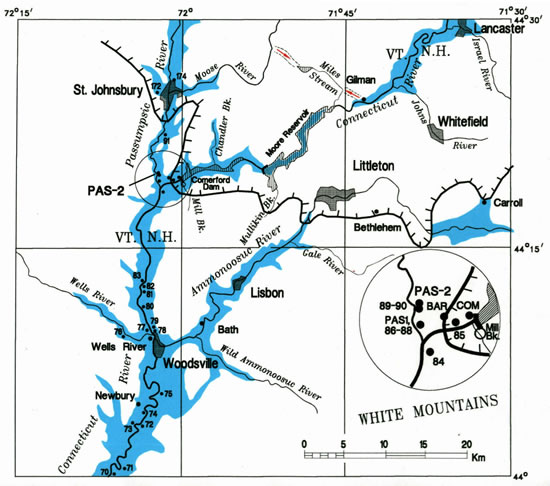
The upper Connecticut Valley in New England showing the region of the Newbury, VT section. Numbered sites are varve sections of Antevs (1922, 1928) and others are from (Ridge and others, 1996). The ice margin represents the Littleton-St. Johnsbury Readvance limit. Blue areas are late Pleistocene lakes shown at their full extent.
At the Newbury outcrop Antevs counted an additional ~750 varves above the end of his upper Connecticut normal curves (NE 7750) but did not measure these very thin varves. Varves in the upper part of the section (above NE 7400) would have been difficult, if not impossible, for Antevs to measure and obtain a meaningful varve record using his field measurement techniques (See Field Methods - Field Measurement). The varves are very clayey and thin, making them difficult to analyze on an outcrop.
In 1996-1997 Jack Ridge and his students at Tufts University collected two sets of overlapping outcrop cores of the Newbury section that were split, partially dried, and prepared for measurement on digital images using a computer. The resulting detailed measurement of the Newbury section spanned the transition from glacial to non-glacial varves and covered NE 6944-8679 +35/-20. The precision listed here for NE 8679 is cumulative beginning at about NE 7500.
Findings at Newbury
As shown below, the Newbury varve record has been analyzed as a 5-yr running average of varve thickness. Changes in varve thickness may represent a number of climatic, glacial, and lacustrine events over the 1736 years spanned by the section. The plot shown below was originally published in Ridge and Toll, (1999) but has been updated here with the most recent NEVC calibration (See NEVC Calibration). Using the calibration it has been possible to compare the Newbury record to the oxygen isotope records from Greenland ice cores (Dansgaard and others, 1998, 1993; Stuiver and others, 1995). Using the ice core records as a measure of climatic events and change, the apparent match of the two records has been used to support the link between climate events and varve thickness. There is a one to one correspondence of known climatic events and pronounced changes in varve thickness as well as some other patterns.
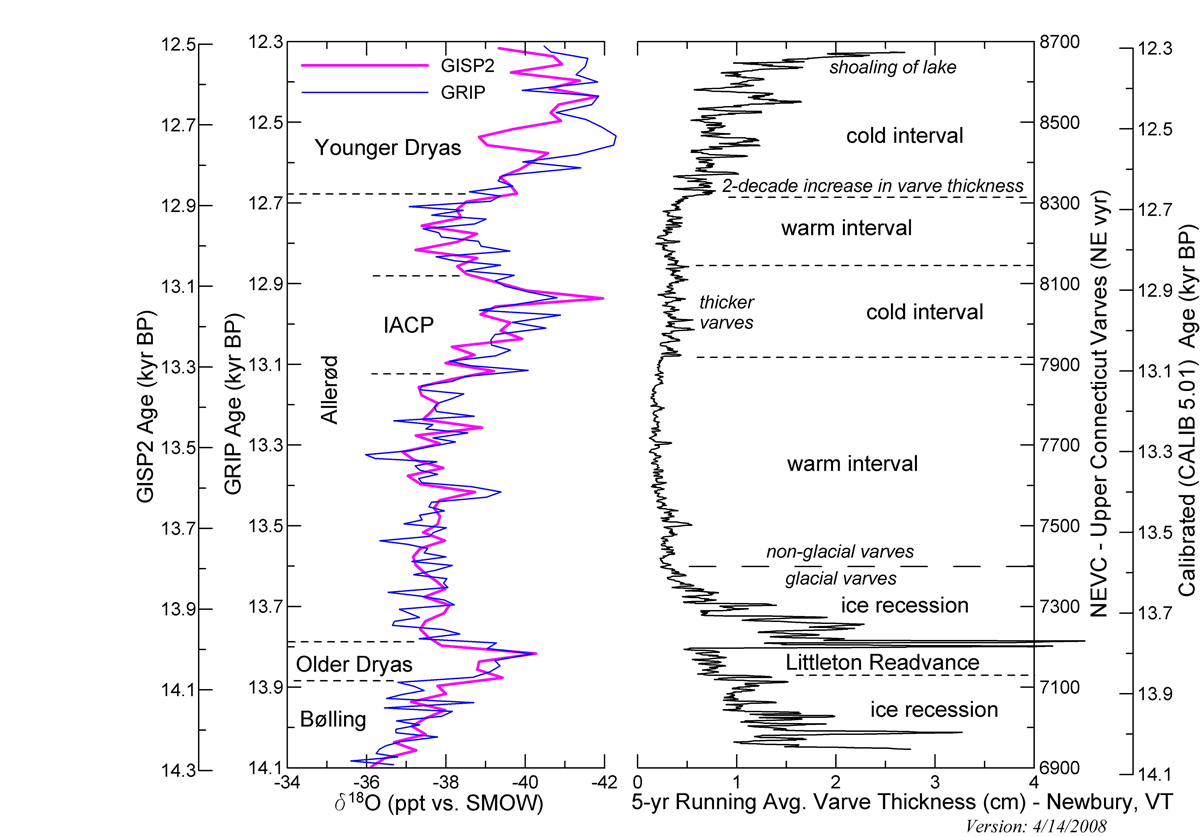
5-yr running average of varve thickness at the Newbury section compared to ice core records from Greenland. Click on image to download a larger version (~300 KB JPEG).
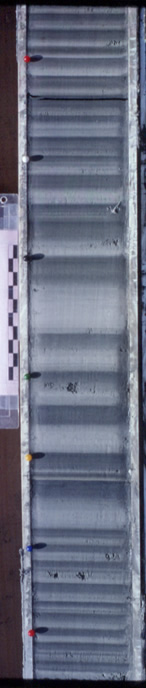
Newbury varves deposited during initial recession of ice and prior to the Littleton-St. Johnsbury Readvance. Note the thick varves in the core that may represent flood events from the release of water of proglacial lakes in tributary valleys.
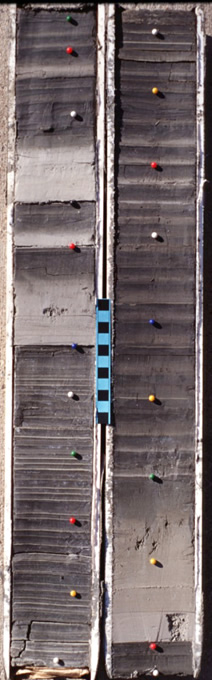
The bottom of the Newbury core on the left shows thin varves of uniform thickness deposited during the Littleton-St. Johnsbury Readvance when the ice was about 30 km north of Newbury. The end of the period of readvance is abruptly marked by a series of flood events beginning in the middle of the left core. The two cores overlap by about a year with the top of the left core matching the bottom of the right core. The largest and 4th major flood is at the bottom of the right core followed by relatively thick ice recessional varves.
There are two parts to the Newbury record, an early part (NE 6944 to ~7370) in which the varves are glacial, and a later part (NE 7370-8679) in which the varves are non-glacial. Interpretations of these two parts of the stratigraphy provide support for the theories about varve thickness in relation to readvances and climate.
The glacial part of the record shows distinct changes in conjunction with a known readvance (Littleton - St. Johnsbury Readvance) that constructed a large end moraine ~30 km north of Newbury. Below is an interpretation of a response of varve deposition to glacial and climatic events.
NE 6944 to shortly after 7100
During ice recession and prior to the readvance, varves are relatively thick and have spikes in thickness associated with the periodic release of water from proglacial lakes that formed in tributary valleys. This is clearly a sequence that also shows a general thinning of varves (ramping down) and is associated with recession of the ice sheet. On the ice core records this corresponds to the end of warmth during the B�lling interval.
NE 7100 - 7200
During the time of the readvance (about a century) meltwater release from the glacier was reduced and varves became thinner. In addition, spikes in thickness associated with floods from proglacial lakes are absent from the record (see core below). This event corresponds exactly to cooling on the ice core records during the Older Dryas event.
NE 7200 - 7350
Following the readvance, recession of the ice under warmer climatic conditions resumed and varve thickness suddenly increased dramatically while spikes from floods again appeared in the record (see core below). Again varves ramp down in thickness as the ice sheet recedes. This corresponds to warming at the beginning of the Aller�d event on the ice core records.
By about NE 7350-7400 the ice sheet had receded from the drainage basin or its influence became secondary to non-glacial sediment delivery to the lake in the Connecticut Valley. Varves from this time on are very thin and reflect non-glacial deposition in the basin. There is also an absence of frequent flood events related to recession of the ice sheet. The non-glacial part of the record (above ~NE 7370) begins in the Aller�d with deposition of thin varves of relatively uniform thickness and appears to show prominent and persistent changes corresponding to late glacial variations in climate.
NE 7350 - 7923
Thin varves of this time reflect relatively warm climatic conditions of the first half of the Aller�d. A spike in thickness at NE 7500 is basin-wide and probably records a change in lake level or the release of water in a large lake up valley (Lake Coos, northeast corner of map above), that triggered higher sedimentation rates, which eventually ramp down over about a century following the event. A small spike in varve thickness at shortly after NE 7700 is also probably non-climatic in nature but at this point has not been explained. It may have an origin similar to the event at NE 7500 although of smaller magnitude.
NE 7923 - 8170
A sudden increase in varve thickness occurs at ~NE 7923 and is maintained until NE 8170 when there is a rapid decrease. The increase in thickness (middle of the core shown below) is also associated with a prominent 20-25 year oscillation in thickness that is very conspicuous during this time and is actually visible in cores. This time period corresponds well to the IACP (Intra-Aller�d Cold Pulse) seen in the ice core records and in other lake sediment studies across northern New England and the maritime provinces of Canada where it has been identified as the Killarney Oscillation (Levesque and others, 1993, 1997a, 1997b; Cwynar and Levesque, 1995; Yu and Eicher, 1998). Increased erosion under cooler climatic conditions appears to be responsible for increased varve thickness in the Connecticut Valley.
NE 8170 - 8310
Thinner varves of this time reflect relatively warm climatic conditions of the last part of the Aller�d.
NE 8310 to top of record
Over about a decade or two there is a pronounced thickening of varves (see core image below) that appears to correspond to the beginning of the Younger Dryas. In addition, summer layers in the varves become sandier at this time. Like the IACP period the Younger Dryas varve record may also have a 20-25 year oscillation in varve thickness. Varves higher in the Younger Dryas interval become thicker and sandier (to several centimeters) due to the shallowing of the lake by sediment infilling and the decanting of water by isostatic tilting in the region.
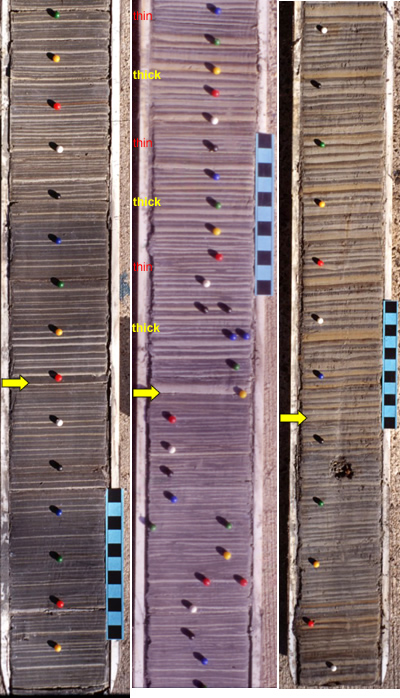
Left: Newbury core section showing the spike in varve thickness at NE 7500 (arrow) that may represent a change in lake level or large flood event much further up valley. Middle: Newbury core showing the transition at the beginning of the IACP (NE 7923, arrow). Prominent groups of thick and thin varves that mark 20 to 25-yr cycles are identified. Right: The transition (arrow) from thin to thicker sandy varves that marks the beginning of the Younger Dryas in the Newbury section.
References
- Antevs, Ernst, 1922, The recession of the last ice sheet in New England: American Geographical Society Research Series, no. 11, 120 p. (with a preface and contributions by J.W. Goldthwait).
- Antevs, Ernst, 1928, The last glaciation, with special reference to the ice sheet in northeastern North America: American Geographical Society Research Series, no. 17, 292 p.
- Cwynar, L.C. and Levesque, A.J., 1995, Chironomid evidence for late-glacial climatic reversals in Maine: Quaternary Research v. 43, p. 405-413.
- Dansgaard, W., White, J.W.C., and Johnsen, S.J., 1989, The abrupt termination of the Younger Dryas climate event: Nature, v. 339, p. 532-534.
- Dansgaard, W., Johnsen, S.J., Clausen, H.B., Dahl-Jensen, D., Gundestrup, N.S., Hammer, C.U., Hvidberg, C.S., Steffensen, J.P., Sveinbj�rnsdottir, Jouzel, J., and Bond, G., 1993, Evidence for general instability of past climate from a 250-kyr ice-core record: Nature v. 364, p. 218-220.
- Kerr, R.A., 2000, Viable but variable ancient El Ni�o spied: Science, v. 288, p. 945. (review of Rittenour and others, 2000)
- Levesque, A.J., Mayle, F.E., Walker, I.R., and Cwynar, L.C., 1993, A previously unrecognized late-glacial cold event in eastern North America: Nature, v. 361, p. 623-626.
- Levesque, A.J., Cwynar, L.C., and Walker, I.R., 1997a, Exceptionally steep north-south gradients in lake temperatures during the last deglaciation: Nature, v. 385, p. 423-426.
- Levesque, A.J., Mayle, F.E., Walker, I.R., and Cwynar, L.C., 1997b, The amphi-Atlantic oscillation: A proposed late-glacial climatic event: Quaternary Science Reviews, v. 12, p. 629-643.
- Ridge, J.C. and Toll, N.J., 1999, Are late-glacial climate oscillations recorded in varves of the upper Connecticut Valley, northeastern United States?: Geologiska Foreningens i Stockholm Forhandlingar, v.121, p.187-193.
- Ridge, J.C., Thompson, W.C., Brochu, M., Brown, S., and Fowler, B.K., 1996, Glacial Geology of the Upper Connecticut Valley in the Vicinity of the Lower Ammonoosuc and Passumpsic Valleys of New Hampshire and Vermont, in M.R. Van Baalen (ed.), Guidebook to Field Trips in Northern New Hampshire and Adjacent Regions of Maine and Vermont, 88th Annual Meeting: New England Intercollegiate Geologic Conference, Harvard University, Cambridge, Massachusetts, p. 309-339.
- Rittenour, T.M., Brigham-Grette, J., and Mann, M.E., 2000, El Ni�o-like climate teleconnections in New England during the Late Pleistocene: Science, v. 288, p. 1039-1042.
- Stuiver, M., Grootes, P.M., and Braziunas, T.F., 1995, The GISP2 ?18O climate record of the past 16,500 years and the role of the sun, ocean, and volcanoes: Quaternary Research, v. 44, p. 341-354.
- Yu, Z. & Eicher, U., 1998, Abrupt climate oscillations during the last deglaciation in central North America: Science, v. 282, p. 2235-2238.