
Varves of the Month for 12/1/2009 - 12/31/2009
Connecticut Valley Varves, Perry Hill Basin, Charlestown, New Hampshire
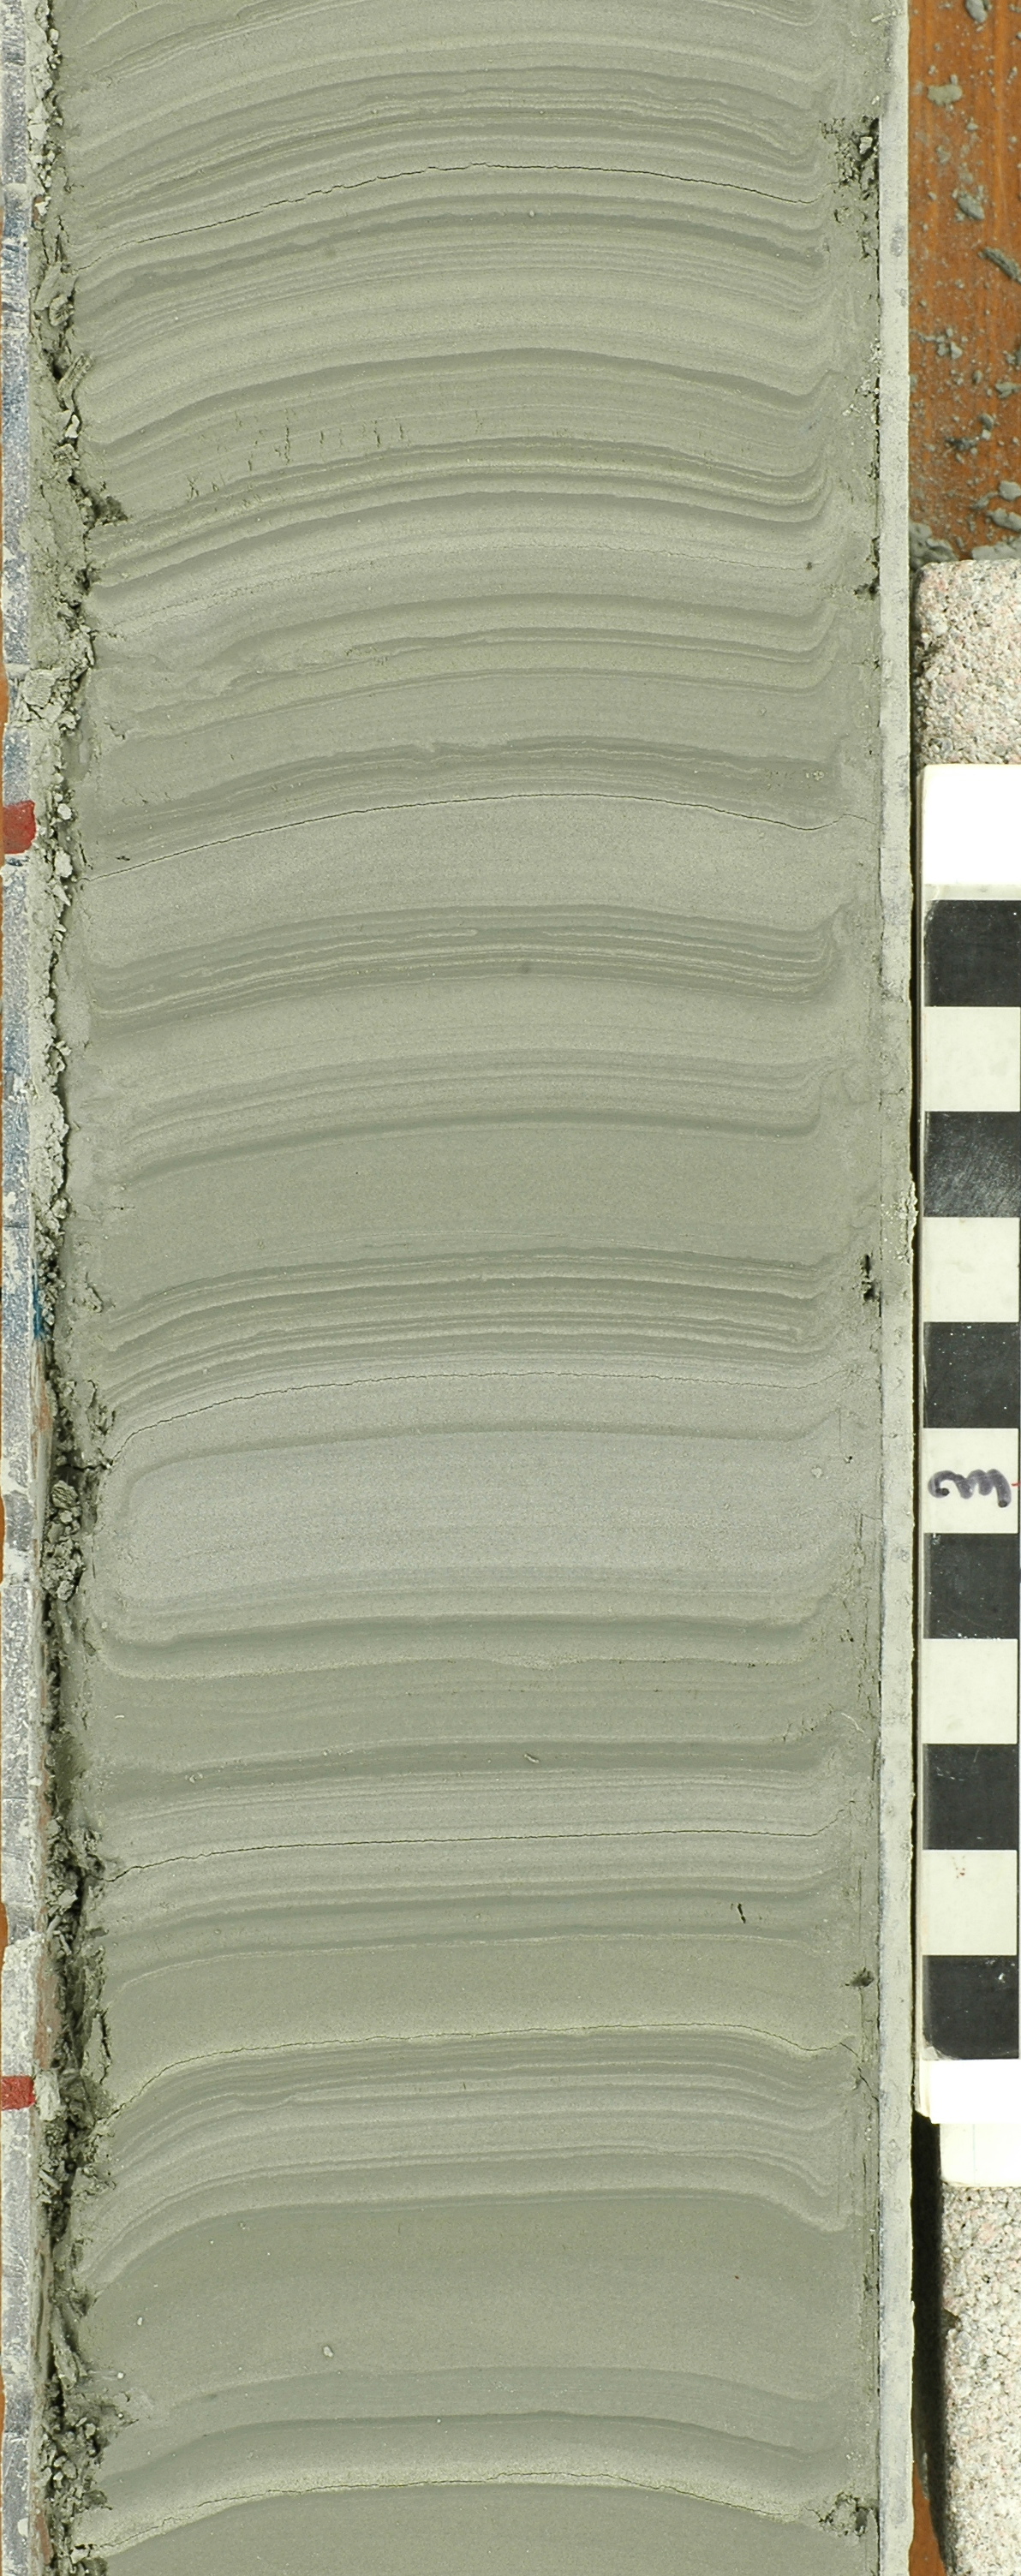
Scale bar in cm.
Click on image to download original image file
Since February 2009 and continuing until January 2010 is a series of images that show the progressive change in varve deposition that occurred over time in the Perry Hill Basin. The Perry Hill Basin core sites, PHS and PHN which is 0.5 km further north, are in the same varve-filled basin at the west flank of Perry Hill in Charlestown, NH just south of Claremont and have very similar varve stratigraphy. The complete section contains over 500 varves from ice-proximal varves at the base that rest on till to very ice-distal varves at the top of the section that fade into sediment in which varves are difficult to discern because winter layers are erratically preserved. In the following months we will show varves that get progressively younger and more ice-distal as ice receded further and further north from the Perry Hill Basin. Varves-of-the-Month for September and October 2008 were also from Perry Hill Basin cores (see the archive at the bottom of this page). The general type and relative ages of the varves in the New England Varve Chronology (NEVC) in past Varves-of-the-Month images from the Perry Hill Basin are indicated on the varve plot and below with the oldest varves at the bottom of the list:
- December 2009 above NE7038 (This month) Distal (varved?) lake sediment
- November 2009 NE6985-6997: Distal varves
- October 2009 NE6944-6953: Distal varves
- September 2009 NE6897-6905: Distal varves
- August 2009 NE6853-6864: Transitional varves
- July 2009 NE6804-6818: Transitional varves + flood event
- June 2009 NE6751-6768: Thinning transitional varves
- May 2009 NE6687-6691: Thick transitional varves
- April 2009 NE6652-6655: Return to ice-proximal varves
- September 2008 NE6640-6644: Ice-proximal/transitional varves + flood event
- March 2009 NE6631-6635: Return to ice-proximal varves
- October 2008 NE6622-6625: Ice-proximal to transitional varves
- February 2009 NE6590-6593: Thick, ice-proximal varves
This month's image was chosen because of the detail that it shows near the top of the Perry Hill section (PHS core) in which varves are difficult to define. This is a distal sequence from glacial Lake Hitchcock of the Connecticut Valley of south-central New Hampshire. The sample was collected in the summer of 2007 with a Central Mining Equipment continuous sampling system running inside a hollow-stem auger at a depth of 16.1-15.3 feet. The top of this interval is 87.2 ft and at least 470 years above the bottom of the section at the PHS core site where varves rest on till. After a sporadic match, following the major flood event at ~NE6810, the Perry Hill and NEVC records again match well above ~NE6905 through NE7010. Above this the Perry Hill section could not be matched to the NEVC because of difficulties in consistently defining varve boundaries in the Perry Hill section. For this reason the boundaries and numbers of varves in the New England Varve Chronology are not shown as in past months and a plot of the Perry Hill varves vs. the NEVC is not given.
The sediment in this month's image is largely from tributary drainages and was remobilized by lake bottom currents. Sand became more prevalent at the Perry Hill sites as prograding deltas delivered more sandy sediment further into the lake basin where it was picked up by strong down valley currents. Major sources of sand to the Perry Hill basin were the Sugar River Valley 4 km to the north at Claremont and a prograding delta at the mouth of the Little Sugar River just 1.0 km to the south, while small local streams on the east side of the basin also contributed some sediment. The change to sandy distal varves and then sediment in which varves are hard to discern up section is a natural consequence of ice recession and the shoaling of the lake by sediment infilling. The sediment shown here was deposited at least 470 years after recession of the ice sheet when the ice-front had receded approximately 130 kilometers north of the PHS core site to near St. Johnsbury, VT and Littleton, NH. The ice recession rate in the Connecticut Valley at this time averaged approximately 280 m/yr, which is very rapid for a terrestrial glacier where most of the ablation is by melting.
Most of the lighter gray areas on the image have stacks of graded fine sand to muddy silt beds representing melting and storm events that deposited sediment during the summer or melt season. In many places the light gray sediment is very regularly rhythmic, suggesting diurnal cycles. In other areas are clusters of dark clayey beds that appear to represent late summer and early winter deposition but distinct very clayey beds easily defined a winter layers are hard to consistently identify. Most of the clayey areas are split by fine sand and silt beds and partings of varying thickness. The deposition of the sand and silt layers is sometimes rhythmic, suggesting diurnal cycles, and occurred prior to the end of the melt season. This means that clay deposition was initiated during the melt season and was not a strictly winter phenomenon. Also, significant clay deposition may not have occurred during every winter making annual layers difficult to discern. Correlative sediments further north in the Connecticut Valley are less sandy, distinctly varved, and are easily correlated with each other in the upper valley and to the NEVC.
Past Varves of the Month...
- 6/1/2008 - Connecticut Valley Varves at Canoe Brook, Dummerston, Vermont
- 4/27/2008 - Connecticut Valley Varves from Kelsey Ferguson Brickyard, Redland Brick Co., East Windsor, Connecticut.
- 7/1/2008 - Champlain Valley varves at Keesville, NY
- 8/1/2008 - Connecticut Valley Varves at Aldrich Brook, Westmoreland, New Hampshire
- 9/1/2008 - Connecticut Valley Varves, Perry Hill Basin (PHS), Charlestown, New Hampshire
- 10/1/2008 - Connecticut Valley Varves, Perry Hill Basin (PHN), Charlestown, New Hampshire.
- 11/1/2008 - Connecticut Valley Varves, Aldrich Brook site, Westmoreland, New Hampshire
- 12/1/2008 - Connecticut Valley Varves, Aldrich Brook site, Westmoreland, New Hampshire
- 1/1/2009 - Mine fire reclamation site, Olyphant, Pennsylvania
- 2/1/2009 - Connecticut Valley Varves, Perry Hill Basin (PHS), Charlestown, New Hampshire
- 3/1/2009 - Connecticut Valley Varves, Perry Hill Basin, Charlestown, New Hampshire
- 4/1/2009 - Connecticut Valley Varves, Perry Hill Basin, Charlestown, New Hampshire.
- 5/1/2009 - Connecticut Valley Varves, Perry Hill Basin, Charlestown, New Hampshire
- 6/1/2009 - Connecticut Valley Varves, Perry Hill Basin, Charlestown, New Hampshire
- 7/1/2009 - Connecticut Valley Varves, Perry Hill Basin, Charlestown, New Hampshire
- 8/1/2009 - Connecticut Valley Varves, Perry Hill Basin, Charlestown, New Hampshire
- 9/1/2009 - Connecticut Valley Varves, Perry Hill Basin, Charlestown, New Hampshire
- 10/1/2009 - Connecticut Valley Varves, Perry Hill Basin, Charlestown, New Hampshire
- 11/1/2009 - Connecticut Valley Varves, Perry Hill Basin, Charlestown, New Hampshire.
- 1/1/2010 - Connecticut Valley Varves, Perry Hill Basin, Charlestown, New Hampshire
- 2/1/2010 - Varves along Starrucca Creek near Lanesboro, Pennsylvania
- 3/1/2010 - Varves in the Don Valley, Toronto
- 4/1/2010 - Varves along Sandy Stream, Dennistown Plantation near Jackman, Maine
- 5/3/2010 - Varves from Glacial Lake Great Falls in Montana
- 6/4/2010 - Varves from Charlestown, NH
- 7/1/2010 - Varves from Redlands Brick Co. (Kelsey Ferguson Brickyard, South Windsor, Connecticut) - A varve that Antevs missed
- 8/1/2010 - Varves from Glastonbury, Connecticut
- 9/1/2010 - Varves from North Hatfield, Massachusetts
- 10/1/2010 - Varves from Newbury, Vermont
- 11/1/2010 - Varves from Newbury, Vermont
- 12/1/2010 - Varves from Newbury, Vermont
- 2/1/2011 - Connecticut Valley Varves at North Hatfield, Massachusetts
- 3/1/2011 - Connecticut Valley Varves Kelsey Ferguson (Redlands Brick Co.), South Windsor, Connecticut
- 6/1/2011 - Connecticut Valley Varves: Core at Scantic, East Windsor, Connecticut
- 8/1/2011 - Varves of West Canada Creek Valley, western Mohawk Valley
- 10/1/2011 - Varves of West Canada Creek Valley, western Mohawk Valley collected in Newport, NY
- 12/1/2011 - Connecticut Valley Varves at Claremont Junction, NH
- 3/1/2012 - Connecticut Valley Varves at Westmoreland, NH
- 7/1/2012 - Connecticut Valley Varves at Rt. 12A drill site in North Charlestown, N.H.